Search for Indicators
Access to Care
This dashboard shows data related to access to healthcare services in Washtenaw County.
Indicator Gauge Icon Legend
Legend Colors
Red is bad, green is good, blue is not statistically different/neutral.
Compared to Distribution
 the value is in the best half of communities.
 the value is in the 2nd worst quarter of communities.
 the value is in the worst quarter of communities.
Compared to Target
 meets target;
  does not meet target.
Compared to a Single Value
 lower than the comparison value;
 higher than the comparison value;
 not statistically different from comparison value.
Trend

 non-significant change over time;
 significant change over time;
  no change over time.
Compared to Prior Value
 higher than the previous measurement period;
 lower than the previous measurement period;
 no statistically different change from previous measurement period.
 Significantly better than the overall value
 Significantly worse than the overall value
 Significantly different than the overall value
 No significant difference with the overall value
 No data on significance available
Health / Health Care Access & Quality
Health / Health Care Access & Quality
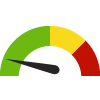
30-Day Hospital Readmission Rate: Medicare Population
Value
Compared to:
30-Day Hospital Readmission Rate: Medicare Population County: Washtenaw
30-Day Hospital Readmission Rate: Medicare Population County: Washtenaw
14.5%
(2019)
Compared to:

MI Counties
The distribution is based on data from 74 Michigan counties.
MI Value
(15.6%)
The regional value is compared to the Michigan State value.
US Value
(14.9% in 2015)
The regional value is compared to the national value.
Prior Value
(15.0%)
Prior Value compares a measured value with the previously measured value. Confidence intervals were taken into account in determining the direction of the comparison.
Trend
This comparison measures the indicator’s values over multiple time periods.<br>The Mann-Kendall Test for Statistical Significance is used to evaluate the trend<br>over 4 to 10 periods of measure, subject to data availability and comparability.
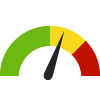
Adults who have had a Routine Checkup County: Washtenaw
Adults who have had a Routine Checkup County: Washtenaw
69.8%
(2020-2022)
Compared to:


MI Value
(77.7%)
The regional value is compared to the Michigan State value.
Prior Value
(72.1%)
Prior Value compares a measured value with the previously measured value. Confidence intervals were not taken into account in determining the direction of the comparison.
Trend
This comparison measures the indicator’s values over multiple time periods.<br>The Mann-Kendall Test for Statistical Significance is used to evaluate the trend<br>over 4 to 10 periods of measure, subject to data availability and comparability.
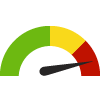
Adults with a Usual Source of Health Care County: Washtenaw
Adults with a Usual Source of Health Care County: Washtenaw
88.7%
(2020-2022)
Compared to:
MI Value
(87.6%)
The regional value is compared to the Michigan State value.
US Value
(84.0% in 2022)
The regional value is compared to the national value. The source for the national value is Behavioral Risk Factor Surveillance System
Prior Value
(88.2%)
Prior Value compares a measured value with the previously measured value. Confidence intervals were not taken into account in determining the direction of the comparison.
Trend
This comparison measures the indicator’s values over multiple time periods.<br>The Mann-Kendall Test for Statistical Significance is used to evaluate the trend<br>over 4 to 10 periods of measure, subject to data availability and comparability.
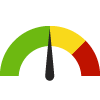
Adults with Health Insurance County: Washtenaw
Adults with Health Insurance County: Washtenaw
95.5%
(2022)
Compared to:
U.S. Counties
The distribution is based on data from 828 U.S. counties and county equivalents.
MI Value
(93.4%)
The regional value is compared to the Michigan State value.
US Value
(88.7%)
The regional value is compared to the national value.
Prior Value
(95.0%)
Prior Value compares a measured value with the previously measured value. Confidence intervals were taken into account in determining the direction of the comparison.
Trend
This comparison measures the indicator’s values over multiple time periods.<br>The Mann-Kendall Test for Statistical Significance is used to evaluate the trend<br>over 4 to 10 periods of measure, subject to data availability and comparability.
Adults without Health Insurance County: Washtenaw
Adults without Health Insurance County: Washtenaw
5.7%
(2021)
Compared to:
MI Counties
The distribution is based on data from 83 Michigan counties.
U.S. Counties
The distribution is based on data from 3,074 U.S. counties and county equivalents.
US Value
(10.8%)
The regional value is compared to the national value.
Children with Health Insurance County: Washtenaw
Children with Health Insurance County: Washtenaw
98.3%
(2022)
Compared to:

U.S. Counties
The distribution is based on data from 828 U.S. counties and county equivalents.
MI Value
(97.3%)
The regional value is compared to the Michigan State value.
US Value
(94.9%)
The regional value is compared to the national value.
Prior Value
(97.3%)
Prior Value compares a measured value with the previously measured value. Confidence intervals were taken into account in determining the direction of the comparison.
Trend
This comparison measures the indicator’s values over multiple time periods.<br>The Mann-Kendall Test for Statistical Significance is used to evaluate the trend<br>over 4 to 10 periods of measure, subject to data availability and comparability.
Medicare Healthcare Costs County: Washtenaw
Medicare Healthcare Costs County: Washtenaw
$9,338
Dollars per enrollee
(2015)
Compared to:


MI Value
($10,317)
The regional value is compared to the Michigan State value.
US Value
($9,729)
The regional value is compared to the national value.
Prior Value
($9,156)
Prior Value compares a measured value with the previously measured value. Confidence intervals were not taken into account in determining the direction of the comparison.
Trend
This comparison measures the indicator’s values over multiple time periods.<br>The Mann-Kendall Test for Statistical Significance is used to evaluate the trend<br>over 4 to 10 periods of measure, subject to data availability and comparability.
Persons with Health Insurance County: Washtenaw
Persons with Health Insurance County: Washtenaw
94.9%
(2021)
Compared to:
MI Counties
The distribution is based on data from 83 Michigan counties.
U.S. Counties
The distribution is based on data from 3,140 U.S. counties and county equivalents.
MI Value
(94.0%)
The regional value is compared to the Michigan State value.
Prior Value
(94.9%)
Prior Value compares a measured value with the previously measured value. Confidence intervals were taken into account in determining the direction of the comparison.
Trend
This comparison measures the indicator’s values over multiple time periods.<br>The Mann-Kendall Test for Statistical Significance is used to evaluate the trend<br>over 4 to 10 periods of measure, subject to data availability and comparability.
HP 2030 Target
(92.4%)
<div>AHS-01: Increase the proportion of people with health insurance <strong>(LEADING HEALTH INDICATOR)</strong></div>
Persons with Private Health Insurance Only County: Washtenaw
Persons with Private Health Insurance Only County: Washtenaw
67.1%
(2022)
Compared to:


MI Value
(54.5%)
The regional value is compared to the Michigan State value.
US Value
(54.8%)
The regional value is compared to the national value.
Prior Value
(67.4%)
Prior Value compares a measured value with the previously measured value. Confidence intervals were not taken into account in determining the direction of the comparison.
Trend
This comparison measures the indicator’s values over multiple time periods.<br>The Mann-Kendall Test for Statistical Significance is used to evaluate the trend<br>over 4 to 10 periods of measure, subject to data availability and comparability.
Persons with Public Health Insurance Only County: Washtenaw
Persons with Public Health Insurance Only County: Washtenaw
15.7%
(2022)
Compared to:

MI Value
(25.1%)
The regional value is compared to the Michigan State value.
US Value
(24.8%)
The regional value is compared to the national value.
Prior Value
(15.3%)
Prior Value compares a measured value with the previously measured value. Confidence intervals were not taken into account in determining the direction of the comparison.
Trend
This comparison measures the indicator’s values over multiple time periods.<br>The Mann-Kendall Test for Statistical Significance is used to evaluate the trend<br>over 4 to 10 periods of measure, subject to data availability and comparability.
Health / Maternal, Fetal & Infant Health
Health / Maternal, Fetal & Infant Health
Mothers who Received Early Prenatal Care
Value
Compared to:
Mothers who Received Early Prenatal Care County: Washtenaw
Mothers who Received Early Prenatal Care County: Washtenaw
80.9%
(2022)
Compared to:
MI Counties
The distribution is based on data from 83 Michigan counties.
MI Value
(76.3%)
The regional value is compared to the Michigan State value.
US Value
(78.3% in 2021)
The regional value is compared to the national value. The source for the national value is Centers for Disease Control and Prevention
Prior Value
(78.2%)
Prior Value compares a measured value with the previously measured value. Confidence intervals were not taken into account in determining the direction of the comparison.
Trend
This comparison measures the indicator’s values over multiple time periods.<br>The Mann-Kendall Test for Statistical Significance is used to evaluate the trend<br>over 4 to 10 periods of measure, subject to data availability and comparability.
Health / Older Adults
Health / Older Adults
Adults 65+ who Received Recommended Preventive Services: Females
Value
Compared to:
Adults 65+ who Received Recommended Preventive Services: Females County: Washtenaw
Adults 65+ who Received Recommended Preventive Services: Females County: Washtenaw
44.3%
(2020)
Compared to:
MI Counties
The distribution is based on data from 83 Michigan counties.
U.S. Counties
The distribution is based on data from 3,141 U.S. counties and county equivalents.
US Value
(37.9%)
The regional value is compared to the national value.
Health / Older Adults
Adults 65+ who Received Recommended Preventive Services: Males
Value
Compared to:
Adults 65+ who Received Recommended Preventive Services: Males County: Washtenaw
Adults 65+ who Received Recommended Preventive Services: Males County: Washtenaw
51.7%
(2020)
Compared to:
MI Counties
The distribution is based on data from 83 Michigan counties.
U.S. Counties
The distribution is based on data from 3,141 U.S. counties and county equivalents.
US Value
(43.7%)
The regional value is compared to the national value.
Health / Oral Health
Adults who Visited a Dentist County: Washtenaw
Adults who Visited a Dentist County: Washtenaw
72.7%
(2020)
Compared to:
MI Counties
The distribution is based on data from 83 Michigan counties.
U.S. Counties
The distribution is based on data from 3,141 U.S. counties and county equivalents.
US Value
(64.8%)
The regional value is compared to the national value.
Health / Oral Health
Children Enrolled in Medicaid who Visited the Dentist the Past Year
Value
Compared to:
Children Enrolled in Medicaid who Visited the Dentist the Past Year County: Washtenaw
Children Enrolled in Medicaid who Visited the Dentist the Past Year County: Washtenaw
49.1%
%
(2022)
Compared to:
Prior Value
(48.8%)
Prior Value compares a measured value with the previously measured value. Confidence intervals were not taken into account in determining the direction of the comparison.
Trend
This comparison measures the indicator’s values over multiple time periods.<br>The Mann-Kendall Test for Statistical Significance is used to evaluate the trend<br>over 4 to 10 periods of measure, subject to data availability and comparability.
State of Michigan Target
(70%)
<div>This target is set forth by the State of Michigan. </div>
Community / Demographics
Female Population County: Washtenaw
Female Population County: Washtenaw
50.1%
(2022)
Compared to:
MI Value
(50.3%)
The regional value is compared to the Michigan State value.
US Value
(50.4%)
The regional value is compared to the national value.
Prior Value
(50.1%)
Prior Value compares a measured value with the previously measured value. Confidence intervals were not taken into account in determining the direction of the comparison.
Trend
This comparison measures the indicator’s values over multiple time periods.<br>The Mann-Kendall Test for Statistical Significance is used to evaluate the trend<br>over 4 to 10 periods of measure, subject to data availability and comparability.
Male Population County: Washtenaw
Male Population County: Washtenaw
49.9%
(2022)
Compared to:
MI Value
(49.7%)
The regional value is compared to the Michigan State value.
US Value
(49.6%)
The regional value is compared to the national value.
Prior Value
(49.9%)
Prior Value compares a measured value with the previously measured value. Confidence intervals were not taken into account in determining the direction of the comparison.
Trend
This comparison measures the indicator’s values over multiple time periods.<br>The Mann-Kendall Test for Statistical Significance is used to evaluate the trend<br>over 4 to 10 periods of measure, subject to data availability and comparability.
Community / Demographics
Population Age 5+ with Language Other than English Spoken at Home
Value
Compared to:
Population Age 5+ with Language Other than English Spoken at Home County: Washtenaw
Population Age 5+ with Language Other than English Spoken at Home County: Washtenaw
15.1%
(2018-2022)
Compared to:
MI Value
(9.9%)
The regional value is compared to the Michigan State value.
US Value
(21.7%)
The regional value is compared to the national value.
Trend
This comparison measures the indicator’s values over multiple time periods.<br>The Mann-Kendall Test for Statistical Significance is used to evaluate the trend<br>over 4 to 10 periods of measure, subject to data availability and comparability.
Population Over Age 65 County: Washtenaw
Population Over Age 65 County: Washtenaw
15.9%
(2022)
Compared to:
MI Value
(18.7%)
The regional value is compared to the Michigan State value.
US Value
(17.3%)
The regional value is compared to the national value.
Prior Value
(15.5%)
Prior Value compares a measured value with the previously measured value. Confidence intervals were not taken into account in determining the direction of the comparison.
Trend
This comparison measures the indicator’s values over multiple time periods.<br>The Mann-Kendall Test for Statistical Significance is used to evaluate the trend<br>over 4 to 10 periods of measure, subject to data availability and comparability.
Population Under Age 18 County: Washtenaw
Population Under Age 18 County: Washtenaw
18.0%
(2022)
Compared to:
MI Value
(21.0%)
The regional value is compared to the Michigan State value.
US Value
(21.7%)
The regional value is compared to the national value.
Prior Value
(18.2%)
Prior Value compares a measured value with the previously measured value. Confidence intervals were not taken into account in determining the direction of the comparison.
Trend
This comparison measures the indicator’s values over multiple time periods.<br>The Mann-Kendall Test for Statistical Significance is used to evaluate the trend<br>over 4 to 10 periods of measure, subject to data availability and comparability.
Total Population County: Washtenaw
Total Population County: Washtenaw
365,536
People
(2023)
Compared to:

Prior Value
(366,504)
Prior Value compares a measured value with the previously measured value. Confidence intervals were not taken into account in determining the direction of the comparison.
Trend
This comparison measures the indicator’s values over multiple time periods.<br>The Mann-Kendall Test for Statistical Significance is used to evaluate the trend<br>over 4 to 10 periods of measure, subject to data availability and comparability.
Community / Transportation
Households without a Vehicle County: Washtenaw
Households without a Vehicle County: Washtenaw
8.1%
(2018-2022)
Compared to:

MI Counties
The distribution is based on data from 83 Michigan counties.
U.S. Counties
The distribution is based on data from 3,133 U.S. counties and county equivalents.
MI Value
(7.2%)
The regional value is compared to the Michigan State value.
US Value
(8.3%)
The regional value is compared to the national value.
Trend
This comparison measures the indicator’s values over multiple time periods.<br>The Mann-Kendall Test for Statistical Significance is used to evaluate the trend<br>over 4 to 10 periods of measure, subject to data availability and comparability.
Workers Commuting by Public Transportation County: Washtenaw
Workers Commuting by Public Transportation County: Washtenaw
3.9%
(2018-2022)
Compared to:

MI Counties
The distribution is based on data from 83 Michigan counties.
U.S. Counties
(2015-2019)
The distribution is based on data from 3,142 U.S. counties and county equivalents.
MI Value
(1.1%)
The regional value is compared to the Michigan State value.
US Value
(3.8%)
The regional value is compared to the national value.
Trend
This comparison measures the indicator’s values over multiple time periods.<br>The Mann-Kendall Test for Statistical Significance is used to evaluate the trend<br>over 4 to 10 periods of measure, subject to data availability and comparability.
HP 2030 Target
(5.3%)
