Search for Indicators
Whitmore Lake & Northfield Township Dashboard
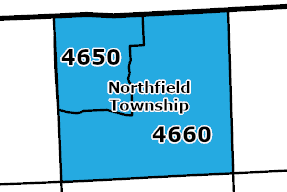
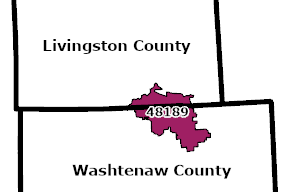
Data on this dashboard are for Zip Code 48189 and two census tracts, 26161465000 (shown as 4650 on map below) and 26161466000 (shown as 4660 on map below). Zip Code 48189 is the Whitmore Lake community, which is located across Washtenaw and Livingston County. The two census tracts are Northfield Township. Census tract 26161465000 roughly corresponds to the portion of Whitmore Lake that is within Washtenaw county. Census tract 26161465000 roughly corresponds to the rural area of Northfield Township, outside of Whitmore Lake.

Indicator Gauge Icon Legend
Legend Colors
Red is bad, green is good, blue is not statistically different/neutral.
Compared to Distribution
 the value is in the best half of communities.
 the value is in the 2nd worst quarter of communities.
 the value is in the worst quarter of communities.
Compared to Target
 meets target;
  does not meet target.
Compared to a Single Value
 lower than the comparison value;
 higher than the comparison value;
 not statistically different from comparison value.
Trend

 non-significant change over time;
 significant change over time;
  no change over time.
Compared to Prior Value
 higher than the previous measurement period;
 lower than the previous measurement period;
 no statistically different change from previous measurement period.
Access to Health Care
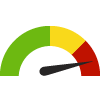
Adults who have had a Routine Checkup County: Washtenaw
Adults who have had a Routine Checkup County: Washtenaw
69.8%
(2020-2022)
Compared to:


MI Value
(77.7%)
The regional value is compared to the Michigan State value.
Prior Value
(72.1%)
Prior Value compares a measured value with the previously measured value. Confidence intervals were not taken into account in determining the direction of the comparison.
Trend
This comparison measures the indicator’s values over multiple time periods.<br>The Mann-Kendall Test for Statistical Significance is used to evaluate the trend<br>over 4 to 10 periods of measure, subject to data availability and comparability.
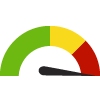
Adults who have had a Routine Checkup Zip Code: 48189
Adults who have had a Routine Checkup Zip Code: 48189
69.5%
(2021)
Compared to:
MI Zip Codes
The distribution is based on data from 972 Michigan zip codes.
U.S. Zip Codes
The distribution is based on data from 31,435 U.S. zip codes.
Washtenaw, MI County Value
(68.5%)
The regional value is compared to the Washtenaw County value.
US Value
(73.6%)
The regional value is compared to the national value.
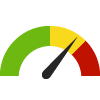
Adults who have had a Routine Checkup Census Tract: 26161465000
Adults who have had a Routine Checkup Census Tract: 26161465000
65.7%
(2021)
Compared to:
MI Census Tracts
The distribution is based on data from 2,745 Michigan census tracts.
U.S. Census Tracts
The distribution is based on data from 68,167 U.S. census tracts.
Washtenaw, MI County Value
(68.5%)
The regional value is compared to the Washtenaw County value.
US Value
(73.6%)
The regional value is compared to the national value.
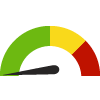
Adults who have had a Routine Checkup Census Tract: 26161466000
Adults who have had a Routine Checkup Census Tract: 26161466000
70.4%
(2021)
Compared to:
MI Census Tracts
The distribution is based on data from 2,745 Michigan census tracts.
U.S. Census Tracts
The distribution is based on data from 68,167 U.S. census tracts.
Washtenaw, MI County Value
(68.5%)
The regional value is compared to the Washtenaw County value.
US Value
(73.6%)
The regional value is compared to the national value.
Adults without Health Insurance County: Washtenaw
Adults without Health Insurance County: Washtenaw
5.7%
(2021)
Compared to:
MI Counties
The distribution is based on data from 83 Michigan counties.
U.S. Counties
The distribution is based on data from 3,074 U.S. counties and county equivalents.
US Value
(10.8%)
The regional value is compared to the national value.
Adults without Health Insurance Zip Code: 48189
Adults without Health Insurance Zip Code: 48189
5.7%
(2021)
Compared to:
MI Zip Codes
The distribution is based on data from 972 Michigan zip codes.
U.S. Zip Codes
The distribution is based on data from 31,435 U.S. zip codes.
Washtenaw, MI County Value
(5.7%)
The regional value is compared to the Washtenaw County value.
US Value
(10.8%)
The regional value is compared to the national value.
Adults without Health Insurance Census Tract: 26161465000
Adults without Health Insurance Census Tract: 26161465000
6.8%
(2021)
Compared to:

MI Census Tracts
The distribution is based on data from 2,745 Michigan census tracts.
U.S. Census Tracts
The distribution is based on data from 68,167 U.S. census tracts.
Washtenaw, MI County Value
(5.7%)
The regional value is compared to the Washtenaw County value.
US Value
(10.8%)
The regional value is compared to the national value.
Adults without Health Insurance Census Tract: 26161466000
Adults without Health Insurance Census Tract: 26161466000
4.3%
(2021)
Compared to:
MI Census Tracts
The distribution is based on data from 2,745 Michigan census tracts.
U.S. Census Tracts
The distribution is based on data from 68,167 U.S. census tracts.
Washtenaw, MI County Value
(5.7%)
The regional value is compared to the Washtenaw County value.
US Value
(10.8%)
The regional value is compared to the national value.
Adults 65+ with Total Tooth Loss County: Washtenaw
Adults 65+ with Total Tooth Loss County: Washtenaw
6.8%
(2020)
Compared to:
MI Counties
The distribution is based on data from 83 Michigan counties.
U.S. Counties
The distribution is based on data from 3,141 U.S. counties and county equivalents.
US Value
(13.4%)
The regional value is compared to the national value.
Adults 65+ with Total Tooth Loss Zip Code: 48189
Adults 65+ with Total Tooth Loss Zip Code: 48189
8.7%
(2020)
Compared to:
MI Zip Codes
The distribution is based on data from 970 Michigan zip codes.
U.S. Zip Codes
The distribution is based on data from 32,230 U.S. zip codes.
Washtenaw, MI County Value
(6.8%)
The regional value is compared to the Washtenaw County value.
US Value
(13.4%)
The regional value is compared to the national value.
Adults 65+ with Total Tooth Loss Census Tract: 26161465000
Adults 65+ with Total Tooth Loss Census Tract: 26161465000
10.4%
(2020)
Compared to:
MI Census Tracts
The distribution is based on data from 2,737 Michigan census tracts.
U.S. Census Tracts
The distribution is based on data from 72,233 U.S. census tracts.
Washtenaw, MI County Value
(6.8%)
The regional value is compared to the Washtenaw County value.
US Value
(13.4%)
The regional value is compared to the national value.
Adults 65+ with Total Tooth Loss Census Tract: 26161466000
Adults 65+ with Total Tooth Loss Census Tract: 26161466000
7.2%
(2020)
Compared to:
MI Census Tracts
The distribution is based on data from 2,737 Michigan census tracts.
U.S. Census Tracts
The distribution is based on data from 72,233 U.S. census tracts.
Washtenaw, MI County Value
(6.8%)
The regional value is compared to the Washtenaw County value.
US Value
(13.4%)
The regional value is compared to the national value.
Adults who Visited a Dentist County: Washtenaw
Adults who Visited a Dentist County: Washtenaw
72.7%
(2020)
Compared to:
MI Counties
The distribution is based on data from 83 Michigan counties.
U.S. Counties
The distribution is based on data from 3,141 U.S. counties and county equivalents.
US Value
(64.8%)
The regional value is compared to the national value.
Adults who Visited a Dentist Zip Code: 48189
Adults who Visited a Dentist Zip Code: 48189
73.1%
(2020)
Compared to:
MI Zip Codes
The distribution is based on data from 972 Michigan zip codes.
U.S. Zip Codes
The distribution is based on data from 32,409 U.S. zip codes.
Washtenaw, MI County Value
(72.7%)
The regional value is compared to the Washtenaw County value.
US Value
(64.8%)
The regional value is compared to the national value.
Adults who Visited a Dentist Census Tract: 26161465000
Adults who Visited a Dentist Census Tract: 26161465000
69.3%
(2020)
Compared to:
MI Census Tracts
The distribution is based on data from 2,745 Michigan census tracts.
U.S. Census Tracts
The distribution is based on data from 72,332 U.S. census tracts.
Washtenaw, MI County Value
(72.7%)
The regional value is compared to the Washtenaw County value.
US Value
(64.8%)
The regional value is compared to the national value.
Adults who Visited a Dentist Census Tract: 26161466000
Adults who Visited a Dentist Census Tract: 26161466000
76.7%
(2020)
Compared to:
MI Census Tracts
The distribution is based on data from 2,745 Michigan census tracts.
U.S. Census Tracts
The distribution is based on data from 72,332 U.S. census tracts.
Washtenaw, MI County Value
(72.7%)
The regional value is compared to the Washtenaw County value.
US Value
(64.8%)
The regional value is compared to the national value.
Access to Health Care
Children Enrolled in Medicaid who Visited the Dentist the Past Year
Value
Compared to:
Children Enrolled in Medicaid who Visited the Dentist the Past Year County: Washtenaw
Children Enrolled in Medicaid who Visited the Dentist the Past Year County: Washtenaw
49.1%
%
(2022)
Compared to:

Prior Value
(48.8%)
Prior Value compares a measured value with the previously measured value. Confidence intervals were not taken into account in determining the direction of the comparison.
Trend
This comparison measures the indicator’s values over multiple time periods.<br>The Mann-Kendall Test for Statistical Significance is used to evaluate the trend<br>over 4 to 10 periods of measure, subject to data availability and comparability.
State of Michigan Target
(70%)
<div>This target is set forth by the State of Michigan. </div>
Children Enrolled in Medicaid who Visited the Dentist the Past Year Zip Code: 48189
Children Enrolled in Medicaid who Visited the Dentist the Past Year Zip Code: 48189
46.5%
%
(2022)
Compared to:
Prior Value
(46.8%)
Prior Value compares a measured value with the previously measured value. Confidence intervals were not taken into account in determining the direction of the comparison.
Trend
This comparison measures the indicator’s values over multiple time periods.<br>The Mann-Kendall Test for Statistical Significance is used to evaluate the trend<br>over 4 to 10 periods of measure, subject to data availability and comparability.
State of Michigan Target
(70%)
<div>This target is set forth by the State of Michigan. </div>
Cervical Cancer Screening: 21-65 County: Washtenaw
Cervical Cancer Screening: 21-65 County: Washtenaw
81.3%
(2020)
Compared to:
MI Counties
The distribution is based on data from 83 Michigan counties.
U.S. Counties
The distribution is based on data from 3,141 U.S. counties and county equivalents.
US Value
(82.8%)
The regional value is compared to the national value.
Cervical Cancer Screening: 21-65 Zip Code: 48189
Cervical Cancer Screening: 21-65 Zip Code: 48189
85.4%
(2020)
Compared to:
MI Zip Codes
The distribution is based on data from 972 Michigan zip codes.
U.S. Zip Codes
The distribution is based on data from 32,400 U.S. zip codes.
Washtenaw, MI County Value
(81.3%)
The regional value is compared to the Washtenaw County value.
US Value
(82.8%)
The regional value is compared to the national value.
Cervical Cancer Screening: 21-65 Census Tract: 26161465000
Cervical Cancer Screening: 21-65 Census Tract: 26161465000
83.6%
(2020)
Compared to:
MI Census Tracts
The distribution is based on data from 2,744 Michigan census tracts.
U.S. Census Tracts
The distribution is based on data from 72,315 U.S. census tracts.
Washtenaw, MI County Value
(81.3%)
The regional value is compared to the Washtenaw County value.
US Value
(82.8%)
The regional value is compared to the national value.
Cervical Cancer Screening: 21-65 Census Tract: 26161466000
Cervical Cancer Screening: 21-65 Census Tract: 26161466000
85.9%
(2020)
Compared to:
MI Census Tracts
The distribution is based on data from 2,744 Michigan census tracts.
U.S. Census Tracts
The distribution is based on data from 72,315 U.S. census tracts.
Washtenaw, MI County Value
(81.3%)
The regional value is compared to the Washtenaw County value.
US Value
(82.8%)
The regional value is compared to the national value.
Colon Cancer Screening County: Washtenaw
Colon Cancer Screening County: Washtenaw
71.5%
(2018)
Compared to:
MI Counties
The distribution is based on data from 83 Michigan counties.
U.S. Counties
The distribution is based on data from 3,142 U.S. counties and county equivalents.
US Value
(66.4%)
The regional value is compared to the national value.
Colon Cancer Screening Zip Code: 48189
Colon Cancer Screening Zip Code: 48189
68.0%
(2018)
Compared to:
MI Zip Codes
The distribution is based on data from 971 Michigan zip codes.
U.S. Zip Codes
The distribution is based on data from 32,309 U.S. zip codes.
Washtenaw, MI County Value
(71.5%)
The regional value is compared to the Washtenaw County value.
US Value
(66.4%)
The regional value is compared to the national value.
Colon Cancer Screening Census Tract: 26161465000
Colon Cancer Screening Census Tract: 26161465000
66.7%
(2018)
Compared to:
MI Census Tracts
The distribution is based on data from 2,741 Michigan census tracts.
U.S. Census Tracts
The distribution is based on data from 72,298 U.S. census tracts.
Washtenaw, MI County Value
(71.5%)
The regional value is compared to the Washtenaw County value.
US Value
(66.4%)
The regional value is compared to the national value.
Colon Cancer Screening Census Tract: 26161466000
Colon Cancer Screening Census Tract: 26161466000
71.1%
(2018)
Compared to:
MI Census Tracts
The distribution is based on data from 2,741 Michigan census tracts.
U.S. Census Tracts
The distribution is based on data from 72,298 U.S. census tracts.
Washtenaw, MI County Value
(71.5%)
The regional value is compared to the Washtenaw County value.
US Value
(66.4%)
The regional value is compared to the national value.
Mammogram in Past 2 Years: 50-74 County: Washtenaw
Mammogram in Past 2 Years: 50-74 County: Washtenaw
73.8%
(2020)
Compared to:
MI Counties
The distribution is based on data from 83 Michigan counties.
U.S. Counties
The distribution is based on data from 3,141 U.S. counties and county equivalents.
US Value
(78.2%)
The regional value is compared to the national value.
HP 2030 Target
(80.3%)
Mammogram in Past 2 Years: 50-74 Zip Code: 48189
Mammogram in Past 2 Years: 50-74 Zip Code: 48189
74.4%
(2020)
Compared to:
MI Zip Codes
The distribution is based on data from 970 Michigan zip codes.
U.S. Zip Codes
The distribution is based on data from 32,250 U.S. zip codes.
Washtenaw, MI County Value
(73.8%)
The regional value is compared to the Washtenaw County value.
US Value
(78.2%)
The regional value is compared to the national value.
HP 2030 Target
(80.3%)
Mammogram in Past 2 Years: 50-74 Census Tract: 26161465000
Mammogram in Past 2 Years: 50-74 Census Tract: 26161465000
74.6%
(2020)
Compared to:
MI Census Tracts
The distribution is based on data from 2,736 Michigan census tracts.
U.S. Census Tracts
The distribution is based on data from 72,248 U.S. census tracts.
Washtenaw, MI County Value
(73.8%)
The regional value is compared to the Washtenaw County value.
US Value
(78.2%)
The regional value is compared to the national value.
HP 2030 Target
(80.3%)
Mammogram in Past 2 Years: 50-74 Census Tract: 26161466000
Mammogram in Past 2 Years: 50-74 Census Tract: 26161466000
76.0%
(2020)
Compared to:
MI Census Tracts
The distribution is based on data from 2,736 Michigan census tracts.
U.S. Census Tracts
The distribution is based on data from 72,248 U.S. census tracts.
Washtenaw, MI County Value
(73.8%)
The regional value is compared to the Washtenaw County value.
US Value
(78.2%)
The regional value is compared to the national value.
HP 2030 Target
(80.3%)
Cholesterol Test History County: Washtenaw
Cholesterol Test History County: Washtenaw
84.0%
(2021)
Compared to:
MI Counties
The distribution is based on data from 83 Michigan counties.
U.S. Counties
The distribution is based on data from 3,074 U.S. counties and county equivalents.
US Value
(86.4%)
The regional value is compared to the national value.
Cholesterol Test History Zip Code: 48189
Cholesterol Test History Zip Code: 48189
86.2%
(2021)
Compared to:
MI Zip Codes
The distribution is based on data from 972 Michigan zip codes.
U.S. Zip Codes
The distribution is based on data from 31,435 U.S. zip codes.
Washtenaw, MI County Value
(84.0%)
The regional value is compared to the Washtenaw County value.
US Value
(86.4%)
The regional value is compared to the national value.
Cholesterol Test History Census Tract: 26161465000
Cholesterol Test History Census Tract: 26161465000
83.6%
(2021)
Compared to:
MI Census Tracts
The distribution is based on data from 2,745 Michigan census tracts.
U.S. Census Tracts
The distribution is based on data from 68,167 U.S. census tracts.
Washtenaw, MI County Value
(84.0%)
The regional value is compared to the Washtenaw County value.
US Value
(86.4%)
The regional value is compared to the national value.
Cholesterol Test History Census Tract: 26161466000
Cholesterol Test History Census Tract: 26161466000
89.6%
(2021)
Compared to:
MI Census Tracts
The distribution is based on data from 2,745 Michigan census tracts.
U.S. Census Tracts
The distribution is based on data from 68,167 U.S. census tracts.
Washtenaw, MI County Value
(84.0%)
The regional value is compared to the Washtenaw County value.
US Value
(86.4%)
The regional value is compared to the national value.
Access to Health Care
Adults 65+ who Received Recommended Preventive Services: Females
Value
Compared to:
Adults 65+ who Received Recommended Preventive Services: Females County: Washtenaw
Adults 65+ who Received Recommended Preventive Services: Females County: Washtenaw
44.3%
(2020)
Compared to:
MI Counties
The distribution is based on data from 83 Michigan counties.
U.S. Counties
The distribution is based on data from 3,141 U.S. counties and county equivalents.
US Value
(37.9%)
The regional value is compared to the national value.
Adults 65+ who Received Recommended Preventive Services: Females Zip Code: 48189
Adults 65+ who Received Recommended Preventive Services: Females Zip Code: 48189
42.1%
(2020)
Compared to:
MI Zip Codes
The distribution is based on data from 970 Michigan zip codes.
U.S. Zip Codes
The distribution is based on data from 32,181 U.S. zip codes.
Washtenaw, MI County Value
(44.3%)
The regional value is compared to the Washtenaw County value.
US Value
(37.9%)
The regional value is compared to the national value.
Adults 65+ who Received Recommended Preventive Services: Females Census Tract: 26161465000
Adults 65+ who Received Recommended Preventive Services: Females Census Tract: 26161465000
42.2%
(2020)
Compared to:
MI Census Tracts
The distribution is based on data from 2,732 Michigan census tracts.
U.S. Census Tracts
The distribution is based on data from 72,137 U.S. census tracts.
Washtenaw, MI County Value
(44.3%)
The regional value is compared to the Washtenaw County value.
US Value
(37.9%)
The regional value is compared to the national value.
Adults 65+ who Received Recommended Preventive Services: Females Census Tract: 26161466000
Adults 65+ who Received Recommended Preventive Services: Females Census Tract: 26161466000
47.1%
(2020)
Compared to:
MI Census Tracts
The distribution is based on data from 2,732 Michigan census tracts.
U.S. Census Tracts
The distribution is based on data from 72,137 U.S. census tracts.
Washtenaw, MI County Value
(44.3%)
The regional value is compared to the Washtenaw County value.
US Value
(37.9%)
The regional value is compared to the national value.
Access to Health Care
Adults 65+ who Received Recommended Preventive Services: Males
Value
Compared to:
Adults 65+ who Received Recommended Preventive Services: Males County: Washtenaw
Adults 65+ who Received Recommended Preventive Services: Males County: Washtenaw
51.7%
(2020)
Compared to:
MI Counties
The distribution is based on data from 83 Michigan counties.
U.S. Counties
The distribution is based on data from 3,141 U.S. counties and county equivalents.
US Value
(43.7%)
The regional value is compared to the national value.
Adults 65+ who Received Recommended Preventive Services: Males Zip Code: 48189
Adults 65+ who Received Recommended Preventive Services: Males Zip Code: 48189
52.5%
(2020)
Compared to:
MI Zip Codes
The distribution is based on data from 970 Michigan zip codes.
U.S. Zip Codes
The distribution is based on data from 32,188 U.S. zip codes.
Washtenaw, MI County Value
(51.7%)
The regional value is compared to the Washtenaw County value.
US Value
(43.7%)
The regional value is compared to the national value.
Adults 65+ who Received Recommended Preventive Services: Males Census Tract: 26161465000
Adults 65+ who Received Recommended Preventive Services: Males Census Tract: 26161465000
50.0%
(2020)
Compared to:
MI Census Tracts
The distribution is based on data from 2,736 Michigan census tracts.
U.S. Census Tracts
The distribution is based on data from 72,188 U.S. census tracts.
Washtenaw, MI County Value
(51.7%)
The regional value is compared to the Washtenaw County value.
US Value
(43.7%)
The regional value is compared to the national value.
Adults 65+ who Received Recommended Preventive Services: Males Census Tract: 26161466000
Adults 65+ who Received Recommended Preventive Services: Males Census Tract: 26161466000
53.9%
(2020)
Compared to:
MI Census Tracts
The distribution is based on data from 2,736 Michigan census tracts.
U.S. Census Tracts
The distribution is based on data from 72,188 U.S. census tracts.
Washtenaw, MI County Value
(51.7%)
The regional value is compared to the Washtenaw County value.
US Value
(43.7%)
The regional value is compared to the national value.
Mothers who Received Early Prenatal Care County: Washtenaw
Mothers who Received Early Prenatal Care County: Washtenaw
80.9%
(2022)
Compared to:
MI Counties
The distribution is based on data from 83 Michigan counties.
MI Value
(76.3%)
The regional value is compared to the Michigan State value.
US Value
(78.3% in 2021)
The regional value is compared to the national value. The source for the national value is Centers for Disease Control and Prevention
Prior Value
(78.2%)
Prior Value compares a measured value with the previously measured value. Confidence intervals were not taken into account in determining the direction of the comparison.
Trend
This comparison measures the indicator’s values over multiple time periods.<br>The Mann-Kendall Test for Statistical Significance is used to evaluate the trend<br>over 4 to 10 periods of measure, subject to data availability and comparability.
Primary Care Provider Rate County: Washtenaw
Primary Care Provider Rate County: Washtenaw
178
Providers per 100,000 population
(2021)
Compared to:
MI Counties
The distribution is based on data from 82 Michigan counties.
U.S. Counties
The distribution is based on data from 2,984 U.S. counties and county equivalents.
MI Value
(78)
The regional value is compared to the Michigan State value.
Prior Value
(176)
Prior Value compares a measured value with the previously measured value. Confidence intervals were not taken into account in determining the direction of the comparison.
Trend
This comparison measures the indicator’s values over multiple time periods.<br>The Mann-Kendall Test for Statistical Significance is used to evaluate the trend<br>over 4 to 10 periods of measure, subject to data availability and comparability.
Adults with a Usual Source of Health Care County: Washtenaw
Adults with a Usual Source of Health Care County: Washtenaw
88.7%
(2020-2022)
Compared to:
MI Value
(87.6%)
The regional value is compared to the Michigan State value.
US Value
(84.0% in 2022)
The regional value is compared to the national value. The source for the national value is Behavioral Risk Factor Surveillance System
Prior Value
(88.2%)
Prior Value compares a measured value with the previously measured value. Confidence intervals were not taken into account in determining the direction of the comparison.
Trend
This comparison measures the indicator’s values over multiple time periods.<br>The Mann-Kendall Test for Statistical Significance is used to evaluate the trend<br>over 4 to 10 periods of measure, subject to data availability and comparability.
Physical Activity
Adults who are Sedentary County: Washtenaw
Adults who are Sedentary County: Washtenaw
14.7%
(2020-2022)
Compared to:

MI Value
(22.6%)
The regional value is compared to the Michigan State value.
US Value
(23.4% in 2022)
The regional value is compared to the national value. The source for the national value is Behavioral Risk Factor Surveillance System
Prior Value
(14.6%)
Prior Value compares a measured value with the previously measured value. Confidence intervals were not taken into account in determining the direction of the comparison.
Trend
This comparison measures the indicator’s values over multiple time periods.<br>The Mann-Kendall Test for Statistical Significance is used to evaluate the trend<br>over 4 to 10 periods of measure, subject to data availability and comparability.
HP 2030 Target
(21.8%)
Adults who are Sedentary Zip Code: 48189
Adults who are Sedentary Zip Code: 48189
16.5%
(2021)
Compared to:
MI Zip Codes
The distribution is based on data from 972 Michigan zip codes.
U.S. Zip Codes
The distribution is based on data from 31,435 U.S. zip codes.
US Value
(23.7%)
The regional value is compared to the national value.
HP 2030 Target
(21.8%)
Adults who are Sedentary Census Tract: 26161465000
Adults who are Sedentary Census Tract: 26161465000
17.0%
(2021)
Compared to:
MI Census Tracts
The distribution is based on data from 2,745 Michigan census tracts.
U.S. Census Tracts
The distribution is based on data from 68,167 U.S. census tracts.
US Value
(23.7%)
The regional value is compared to the national value.
HP 2030 Target
(21.8%)
Adults who are Sedentary Census Tract: 26161466000
Adults who are Sedentary Census Tract: 26161466000
14.6%
(2021)
Compared to:
MI Census Tracts
The distribution is based on data from 2,745 Michigan census tracts.
U.S. Census Tracts
The distribution is based on data from 68,167 U.S. census tracts.
US Value
(23.7%)
The regional value is compared to the national value.
HP 2030 Target
(21.8%)
Access to Exercise Opportunities County: Washtenaw
Access to Exercise Opportunities County: Washtenaw
90.1%
(2024)
Compared to:
MI Counties
The distribution is based on data from 83 Michigan counties.
U.S. Counties
The distribution is based on data from 3,096 U.S. counties and county equivalents.
MI Value
(85.6%)
The regional value is compared to the Michigan State value.
US Value
(84.1%)
The regional value is compared to the national value.
Prior Value
(87.8%)
Prior Value compares a measured value with the previously measured value. Confidence intervals were not taken into account in determining the direction of the comparison.
Food Access
Adult Fruit and Vegetable Consumption County: Washtenaw
Adult Fruit and Vegetable Consumption County: Washtenaw
16.6%
(2013-2015)
Compared to:
MI Value
(14.9%)
The regional value is compared to the Michigan State value.
Prior Value
(22.4%)
Prior Value compares a measured value with the previously measured value. Confidence intervals were taken into account in determining the direction of the comparison.
Adults who Eat Fast Food More Than Once per Week County: Washtenaw
Adults who Eat Fast Food More Than Once per Week County: Washtenaw
14.6%
% of adults
(2015)
Compared to:
Prior Value
(18.9%)
Prior Value compares a measured value with the previously measured value. Confidence intervals were not taken into account in determining the direction of the comparison.
Adults who Eat Fast Food More Than Once per Week Zip Code: 48189
Adults who Eat Fast Food More Than Once per Week Zip Code: 48189
23.0%
% of adults
(2015)
Compared to:
Washtenaw, MI County Value
(14.6%)
The regional value is compared to the Washtenaw, MI county value.
Child Low Fruit and Vegetable Consumption County: Washtenaw
Child Low Fruit and Vegetable Consumption County: Washtenaw
16.0%
%
(2015)
Compared to:
Prior Value
(12.9%)
Prior Value compares a measured value with the previously measured value. Confidence intervals were not taken into account in determining the direction of the comparison.
Adults in Family Reduced Food Intake Due to Cost County: Washtenaw
Adults in Family Reduced Food Intake Due to Cost County: Washtenaw
7.2%
% of adults in family
(2015)
Compared to:
Prior Value
(5.3%)
Prior Value compares a measured value with the previously measured value. Confidence intervals were not taken into account in determining the direction of the comparison.
Adults in Family Reduced Food Intake Due to Cost Zip Code: 48189
Adults in Family Reduced Food Intake Due to Cost Zip Code: 48189
4.7%
% of adults in family
(2015)
Compared to:
Washtenaw, MI County Value
(7.2%)
The regional value is compared to the Washtenaw, MI county value.
Food Environment Index County: Washtenaw
Food Environment Index County: Washtenaw
8.2
(2024)
Compared to:
MI Counties
The distribution is based on data from 82 Michigan counties.
U.S. Counties
The distribution is based on data from 3,108 U.S. counties and county equivalents.
MI Value
(7.2)
The regional value is compared to the Michigan State value.
US Value
(7.7)
The regional value is compared to the national value.
Prior Value
(8.1)
Prior Value compares a measured value with the previously measured value. Confidence intervals were not taken into account in determining the direction of the comparison.
Trend
This comparison measures the indicator’s values over multiple time periods.<br>The Mann-Kendall Test for Statistical Significance is used to evaluate the trend<br>over 4 to 10 periods of measure, subject to data availability and comparability.
Transportation
Households without a Vehicle County: Washtenaw
Households without a Vehicle County: Washtenaw
8.1%
(2018-2022)
Compared to:
MI Counties
The distribution is based on data from 83 Michigan counties.
U.S. Counties
The distribution is based on data from 3,133 U.S. counties and county equivalents.
MI Value
(7.2%)
The regional value is compared to the Michigan State value.
US Value
(8.3%)
The regional value is compared to the national value.
Trend
This comparison measures the indicator’s values over multiple time periods.<br>The Mann-Kendall Test for Statistical Significance is used to evaluate the trend<br>over 4 to 10 periods of measure, subject to data availability and comparability.
Households without a Vehicle Zip Code: 48189
Households without a Vehicle Zip Code: 48189
2.6%
(2018-2022)
Compared to:
MI Zip Codes
The distribution is based on data from 976 Michigan zip codes.
U.S. Zip Codes
The distribution is based on data from 32,399 U.S. zip codes.
Washtenaw, MI County Value
(8.1%)
The regional value is compared to the Washtenaw County value.
Trend
This comparison measures the indicator’s values over multiple time periods.<br>The Mann-Kendall Test for Statistical Significance is used to evaluate the trend<br>over 4 to 10 periods of measure, subject to data availability and comparability.
Households without a Vehicle Census Tract: 26161465000
Households without a Vehicle Census Tract: 26161465000
1.1%
(2015-2019)
Compared to:
MI Census Tracts
The distribution is based on data from 2,736 Michigan census tracts.
U.S. Census Tracts
The distribution is based on data from 72,140 U.S. census tracts.
Washtenaw, MI County Value
(8.2%)
The regional value is compared to the Washtenaw County value.
Trend
This comparison measures the indicator’s values over multiple time periods.<br>The Mann-Kendall Test for Statistical Significance is used to evaluate the trend<br>over 4 to 10 periods of measure, subject to data availability and comparability.
Households without a Vehicle Census Tract: 26161466000
Households without a Vehicle Census Tract: 26161466000
3.3%
(2018-2022)
Compared to:
MI Census Tracts
The distribution is based on data from 2,887 Michigan census tracts.
U.S. Census Tracts
The distribution is based on data from 82,413 U.S. census tracts.
Washtenaw, MI County Value
(8.1%)
The regional value is compared to the Washtenaw County value.
Trend
This comparison measures the indicator’s values over multiple time periods.<br>The Mann-Kendall Test for Statistical Significance is used to evaluate the trend<br>over 4 to 10 periods of measure, subject to data availability and comparability.
Mean Travel Time to Work County: Washtenaw
Mean Travel Time to Work County: Washtenaw
23.6
Minutes
(2018-2022)
Compared to:

MI Counties
The distribution is based on data from 83 Michigan counties.
U.S. Counties
The distribution is based on data from 3,131 U.S. counties and county equivalents.
MI Value
(24.5)
The regional value is compared to the Michigan State value.
US Value
(26.7)
The regional value is compared to the national value.
Trend
This comparison measures the indicator’s values over multiple time periods.<br>The Mann-Kendall Test for Statistical Significance is used to evaluate the trend<br>over 4 to 10 periods of measure, subject to data availability and comparability.
Mean Travel Time to Work Zip Code: 48189
Mean Travel Time to Work Zip Code: 48189
27.0
Minutes
(2018-2022)
Compared to:
MI Zip Codes
The distribution is based on data from 948 Michigan zip codes.
U.S. Zip Codes
The distribution is based on data from 30,389 U.S. zip codes.
Washtenaw, MI County Value
(23.6)
The regional value is compared to the Washtenaw County value.
Trend
This comparison measures the indicator’s values over multiple time periods.<br>The Mann-Kendall Test for Statistical Significance is used to evaluate the trend<br>over 4 to 10 periods of measure, subject to data availability and comparability.
Mean Travel Time to Work Census Tract: 26161465000
Mean Travel Time to Work Census Tract: 26161465000
26.2
Minutes
(2015-2019)
Compared to:
MI Census Tracts
The distribution is based on data from 2,738 Michigan census tracts.
U.S. Census Tracts
The distribution is based on data from 72,164 U.S. census tracts.
Washtenaw, MI County Value
(24.2)
The regional value is compared to the Washtenaw County value.
Trend
This comparison measures the indicator’s values over multiple time periods.<br>The Mann-Kendall Test for Statistical Significance is used to evaluate the trend<br>over 4 to 10 periods of measure, subject to data availability and comparability.
Mean Travel Time to Work Census Tract: 26161466000
Mean Travel Time to Work Census Tract: 26161466000
32.7
Minutes
(2018-2022)
Compared to:

MI Census Tracts
The distribution is based on data from 2,895 Michigan census tracts.
U.S. Census Tracts
The distribution is based on data from 82,376 U.S. census tracts.
Washtenaw, MI County Value
(23.6)
The regional value is compared to the Washtenaw County value.
Trend
This comparison measures the indicator’s values over multiple time periods.<br>The Mann-Kendall Test for Statistical Significance is used to evaluate the trend<br>over 4 to 10 periods of measure, subject to data availability and comparability.
Workers Commuting by Public Transportation County: Washtenaw
Workers Commuting by Public Transportation County: Washtenaw
3.9%
(2018-2022)
Compared to:

MI Counties
The distribution is based on data from 83 Michigan counties.
U.S. Counties
(2015-2019)
The distribution is based on data from 3,142 U.S. counties and county equivalents.
MI Value
(1.1%)
The regional value is compared to the Michigan State value.
US Value
(3.8%)
The regional value is compared to the national value.
Trend
This comparison measures the indicator’s values over multiple time periods.<br>The Mann-Kendall Test for Statistical Significance is used to evaluate the trend<br>over 4 to 10 periods of measure, subject to data availability and comparability.
HP 2030 Target
(5.3%)
Workers Commuting by Public Transportation Zip Code: 48189
Workers Commuting by Public Transportation Zip Code: 48189
0.0%
(2018-2022)
Compared to:
Washtenaw, MI County Value
(3.9%)
The regional value is compared to the Washtenaw County value.
Trend
This comparison measures the indicator’s values over multiple time periods.<br>The Mann-Kendall Test for Statistical Significance is used to evaluate the trend<br>over 4 to 10 periods of measure, subject to data availability and comparability.
HP 2030 Target
(5.3%)
Workers Commuting by Public Transportation Census Tract: 26161465000
Workers Commuting by Public Transportation Census Tract: 26161465000
0.0%
(2015-2019)
Compared to:
Washtenaw, MI County Value
(5.1%)
The regional value is compared to the Washtenaw County value.
Trend
This comparison measures the indicator’s values over multiple time periods.<br>The Mann-Kendall Test for Statistical Significance is used to evaluate the trend<br>over 4 to 10 periods of measure, subject to data availability and comparability.
HP 2030 Target
(5.3%)
Workers Commuting by Public Transportation Census Tract: 26161466000
Workers Commuting by Public Transportation Census Tract: 26161466000
0.0%
(2018-2022)
Compared to:
Washtenaw, MI County Value
(3.9%)
The regional value is compared to the Washtenaw County value.
Trend
This comparison measures the indicator’s values over multiple time periods.<br>The Mann-Kendall Test for Statistical Significance is used to evaluate the trend<br>over 4 to 10 periods of measure, subject to data availability and comparability.
HP 2030 Target
(5.3%)
Workers who Drive Alone to Work County: Washtenaw
Workers who Drive Alone to Work County: Washtenaw
63.4%
(2018-2022)
Compared to:
MI Counties
The distribution is based on data from 83 Michigan counties.
U.S. Counties
The distribution is based on data from 3,133 U.S. counties and county equivalents.
MI Value
(77.1%)
The regional value is compared to the Michigan State value.
US Value
(71.7%)
The regional value is compared to the national value.
Trend
This comparison measures the indicator’s values over multiple time periods.<br>The Mann-Kendall Test for Statistical Significance is used to evaluate the trend<br>over 4 to 10 periods of measure, subject to data availability and comparability.
Workers who Drive Alone to Work Zip Code: 48189
Workers who Drive Alone to Work Zip Code: 48189
73.8%
(2018-2022)
Compared to:
MI Zip Codes
The distribution is based on data from 978 Michigan zip codes.
U.S. Zip Codes
The distribution is based on data from 32,713 U.S. zip codes.
Washtenaw, MI County Value
(63.4%)
The regional value is compared to the Washtenaw County value.
Trend
This comparison measures the indicator’s values over multiple time periods.<br>The Mann-Kendall Test for Statistical Significance is used to evaluate the trend<br>over 4 to 10 periods of measure, subject to data availability and comparability.
Workers who Drive Alone to Work Census Tract: 26161465000
Workers who Drive Alone to Work Census Tract: 26161465000
88.5%
(2015-2019)
Compared to:
MI Census Tracts
The distribution is based on data from 2,748 Michigan census tracts.
U.S. Census Tracts
The distribution is based on data from 72,298 U.S. census tracts.
Washtenaw, MI County Value
(71.8%)
The regional value is compared to the Washtenaw County value.
Trend
This comparison measures the indicator’s values over multiple time periods.<br>The Mann-Kendall Test for Statistical Significance is used to evaluate the trend<br>over 4 to 10 periods of measure, subject to data availability and comparability.
Workers who Drive Alone to Work Census Tract: 26161466000
Workers who Drive Alone to Work Census Tract: 26161466000
79.1%
(2018-2022)
Compared to:
MI Census Tracts
The distribution is based on data from 2,903 Michigan census tracts.
U.S. Census Tracts
The distribution is based on data from 82,602 U.S. census tracts.
Washtenaw, MI County Value
(63.4%)
The regional value is compared to the Washtenaw County value.
Trend
This comparison measures the indicator’s values over multiple time periods.<br>The Mann-Kendall Test for Statistical Significance is used to evaluate the trend<br>over 4 to 10 periods of measure, subject to data availability and comparability.
Mental Health & Substance Abuse
Adults who Binge Drink County: Washtenaw
Adults who Binge Drink County: Washtenaw
17.4%
(2020-2022)
Compared to:
MI Value
(16.9%)
The regional value is compared to the Michigan State value.
US Value
(17.0% in 2022)
The regional value is compared to the national value. The source for the national value is Behavioral Risk Factor Surveillance System
Prior Value
(16.6%)
Prior Value compares a measured value with the previously measured value. Confidence intervals were not taken into account in determining the direction of the comparison.
Trend
This comparison measures the indicator’s values over multiple time periods.<br>The Mann-Kendall Test for Statistical Significance is used to evaluate the trend<br>over 4 to 10 periods of measure, subject to data availability and comparability.
Adults who Binge Drink Zip Code: 48189
Adults who Binge Drink Zip Code: 48189
18.7%
(2021)
Compared to:
MI Zip Codes
The distribution is based on data from 972 Michigan zip codes.
U.S. Zip Codes
The distribution is based on data from 31,435 U.S. zip codes.
Washtenaw, MI County Value
(16.0%)
The regional value is compared to the Washtenaw County value.
US Value
(15.5%)
The regional value is compared to the national value.
Adults who Binge Drink Census Tract: 26161465000
Adults who Binge Drink Census Tract: 26161465000
18.1%
(2021)
Compared to:
MI Census Tracts
The distribution is based on data from 2,745 Michigan census tracts.
U.S. Census Tracts
The distribution is based on data from 68,167 U.S. census tracts.
Washtenaw, MI County Value
(16.0%)
The regional value is compared to the Washtenaw County value.
US Value
(15.5%)
The regional value is compared to the national value.
Adults who Binge Drink Census Tract: 26161466000
Adults who Binge Drink Census Tract: 26161466000
16.2%
(2021)
Compared to:
MI Census Tracts
The distribution is based on data from 2,745 Michigan census tracts.
U.S. Census Tracts
The distribution is based on data from 68,167 U.S. census tracts.
Washtenaw, MI County Value
(16.0%)
The regional value is compared to the Washtenaw County value.
US Value
(15.5%)
The regional value is compared to the national value.
Adults who Smoke County: Washtenaw
Adults who Smoke County: Washtenaw
9.2%
(2020-2022)
Compared to:
MI Value
(16.9%)
The regional value is compared to the Michigan State value.
US Value
(14.0% in 2022)
The regional value is compared to the national value. The source for the national value is Behavioral Risk Factor Surveillance System
Prior Value
(9.6%)
Prior Value compares a measured value with the previously measured value. Confidence intervals were not taken into account in determining the direction of the comparison.
Trend
This comparison measures the indicator’s values over multiple time periods.<br>The Mann-Kendall Test for Statistical Significance is used to evaluate the trend<br>over 4 to 10 periods of measure, subject to data availability and comparability.
HP 2030 Target
(6.1%)
<div>TU-02: Reduce current cigarette smoking in adults <strong>(LEADING HEALTH INDICATOR)</strong></div>
Adults who Smoke Zip Code: 48189
Adults who Smoke Zip Code: 48189
14.6%
(2021)
Compared to:
MI Zip Codes
The distribution is based on data from 972 Michigan zip codes.
U.S. Zip Codes
The distribution is based on data from 31,435 U.S. zip codes.
Washtenaw, MI County Value
(10.6%)
The regional value is compared to the Washtenaw County value.
US Value
(13.5%)
The regional value is compared to the national value.
HP 2030 Target
(6.1%)
<div>TU-02: Reduce current cigarette smoking in adults <strong>(LEADING HEALTH INDICATOR)</strong></div>
Adults who Smoke Census Tract: 26161465000
Adults who Smoke Census Tract: 26161465000
15.8%
(2021)
Compared to:
MI Census Tracts
The distribution is based on data from 2,745 Michigan census tracts.
U.S. Census Tracts
The distribution is based on data from 68,167 U.S. census tracts.
Washtenaw, MI County Value
(10.6%)
The regional value is compared to the Washtenaw County value.
US Value
(13.5%)
The regional value is compared to the national value.
HP 2030 Target
(6.1%)
<div>TU-02: Reduce current cigarette smoking in adults <strong>(LEADING HEALTH INDICATOR)</strong></div>
Adults who Smoke Census Tract: 26161466000
Adults who Smoke Census Tract: 26161466000
11.5%
(2021)
Compared to:
MI Census Tracts
The distribution is based on data from 2,745 Michigan census tracts.
U.S. Census Tracts
The distribution is based on data from 68,167 U.S. census tracts.
Washtenaw, MI County Value
(10.6%)
The regional value is compared to the Washtenaw County value.
US Value
(13.5%)
The regional value is compared to the national value.
HP 2030 Target
(6.1%)
<div>TU-02: Reduce current cigarette smoking in adults <strong>(LEADING HEALTH INDICATOR)</strong></div>
Misuse of Drugs County: Washtenaw
Misuse of Drugs County: Washtenaw
5.1%
% of adults
(2015)
Compared to:
Prior Value
(7.4%)
Prior Value compares a measured value with the previously measured value. Confidence intervals were not taken into account in determining the direction of the comparison.
Misuse of Drugs Zip Code: 48189
Misuse of Drugs Zip Code: 48189
0.0%
% of adults
(2015)
Compared to:
Washtenaw, MI County Value
(5.1%)
The regional value is compared to the Washtenaw, MI county value.
Mental Health Provider Rate County: Washtenaw
Mental Health Provider Rate County: Washtenaw
714
Providers per 100,000 population
(2023)
Compared to:
MI Counties
The distribution is based on data from 83 Michigan counties.
U.S. Counties
The distribution is based on data from 2,956 U.S. counties and county equivalents.
MI Value
(336)
The regional value is compared to the Michigan State value.
Prior Value
(652)
Prior Value compares a measured value with the previously measured value. Confidence intervals were not taken into account in determining the direction of the comparison.
Trend
This comparison measures the indicator’s values over multiple time periods.<br>The Mann-Kendall Test for Statistical Significance is used to evaluate the trend<br>over 4 to 10 periods of measure, subject to data availability and comparability.
Demographics
Average Household Size County: Washtenaw
Average Household Size County: Washtenaw
2.40
Persons per household
(2018-2022)
Compared to:


MI Value
(2.50)
The regional value is compared to the Michigan State value.
US Value
(2.60)
The regional value is compared to the national value.
Trend
This comparison measures the indicator’s values over multiple time periods.<br>The Mann-Kendall Test for Statistical Significance is used to evaluate the trend<br>over 4 to 10 periods of measure, subject to data availability and comparability.
Average Household Size Zip Code: 48189
Average Household Size Zip Code: 48189
2.20
Persons per household
(2018-2022)
Compared to:

Washtenaw, MI County Value
(2.40)
The regional value is compared to the Washtenaw County value.
Trend
This comparison measures the indicator’s values over multiple time periods.<br>The Mann-Kendall Test for Statistical Significance is used to evaluate the trend<br>over 4 to 10 periods of measure, subject to data availability and comparability.
Average Household Size Census Tract: 26161465000
Average Household Size Census Tract: 26161465000
2.50
Persons per household
(2015-2019)
Compared to:
Washtenaw, MI County Value
(2.50)
The regional value is compared to the Washtenaw County value.
Trend
This comparison measures the indicator’s values over multiple time periods.<br>The Mann-Kendall Test for Statistical Significance is used to evaluate the trend<br>over 4 to 10 periods of measure, subject to data availability and comparability.
Average Household Size Census Tract: 26161466000
Average Household Size Census Tract: 26161466000
2.70
Persons per household
(2018-2022)
Compared to:


Washtenaw, MI County Value
(2.40)
The regional value is compared to the Washtenaw County value.
Trend
This comparison measures the indicator’s values over multiple time periods.<br>The Mann-Kendall Test for Statistical Significance is used to evaluate the trend<br>over 4 to 10 periods of measure, subject to data availability and comparability.
Households County: Washtenaw
Households County: Washtenaw
148,704
Households
(2018-2022)
Compared to:

Trend
This comparison measures the indicator’s values over multiple time periods.<br>The Mann-Kendall Test for Statistical Significance is used to evaluate the trend<br>over 4 to 10 periods of measure, subject to data availability and comparability.
Households Zip Code: 48189
Households Zip Code: 48189
6,024
Households
(2018-2022)
Compared to:
Trend
This comparison measures the indicator’s values over multiple time periods.<br>The Mann-Kendall Test for Statistical Significance is used to evaluate the trend<br>over 4 to 10 periods of measure, subject to data availability and comparability.
Households Census Tract: 26161465000
Households Census Tract: 26161465000
2,422
Households
(2015-2019)
Compared to:
Trend
This comparison measures the indicator’s values over multiple time periods.<br>The Mann-Kendall Test for Statistical Significance is used to evaluate the trend<br>over 4 to 10 periods of measure, subject to data availability and comparability.
Households Census Tract: 26161466000
Households Census Tract: 26161466000
951
Households
(2018-2022)
Compared to:
Trend
This comparison measures the indicator’s values over multiple time periods.<br>The Mann-Kendall Test for Statistical Significance is used to evaluate the trend<br>over 4 to 10 periods of measure, subject to data availability and comparability.
