Search for Indicators
Environmental Health Dashboard
This dashboard shows data related to environmental health in Washtenaw County. The data contained within this dashboard provide information on various aspects of the physical environment, which have the potential to impact health. The physical environment includes air, water, soil, food, and the built environment. Exposures to environmental hazards, such as pollutants, extreme weather conditions, or toxic chemicals, can result in acute and/or chronic health conditions.
Indicator Gauge Icon Legend
Legend Colors
Red is bad, green is good, blue is not statistically different/neutral.
Compared to Distribution
 the value is in the best half of communities.
 the value is in the 2nd worst quarter of communities.
 the value is in the worst quarter of communities.
Compared to Target
 meets target;
  does not meet target.
Compared to a Single Value
 lower than the comparison value;
 higher than the comparison value;
 not statistically different from comparison value.
Trend

 non-significant change over time;
 significant change over time;
  no change over time.
Compared to Prior Value
 higher than the previous measurement period;
 lower than the previous measurement period;
 no statistically different change from previous measurement period.
County: Washtenaw
Environmental Health / Air
Value
Compared to:
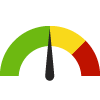
County: Washtenaw Annual Ozone Air Quality
County: Washtenaw Annual Ozone Air Quality
3
(2019-2021)
Compared to:
Air Quality Index
The American Lung Association (ALA) assigns grades A-F to counties (A=1; B=2; C=3; D=4; F=5), based on average annual number of days that ozone levels exceeded U.S. standards during the three year measurement period. The five-point grading scale was used for the distribution (Green = <2; Yellow = 2 - 3; Red = >3). The air quality data is collected by the EPA and summarized by the ALA.
Prior Value
(5)
Prior Value compares a measured value with the previously measured value. Confidence intervals were not taken into account in determining the direction of the comparison.
Trend
This comparison measures the indicator’s values over multiple time periods.<br>The Mann-Kendall Test for Statistical Significance is used to evaluate the trend<br>over 4 to 10 periods of measure, subject to data availability and comparability.
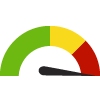
County: Washtenaw Annual Particle Pollution
County: Washtenaw Annual Particle Pollution
2
(2019-2021)
Compared to:

Air Quality Index
The American Lung Association (ALA) assigns grades A-F to counties (A=1; B=2; C=3; D=4; F=5), based on average annual number of days that particle pollution levels exceeded U.S. standards during the three year measurement period. The five-point grading scale was used for the distribution (Green = <2; Yellow = 2 - 3; Red = >3). The air quality data is collected by the EPA and summarized by the ALA.
Prior Value
(2)
Prior Value compares a measured value with the previously measured value. Confidence intervals were not taken into account in determining the direction of the comparison.
Trend
This comparison measures the indicator’s values over multiple time periods.<br>The Mann-Kendall Test for Statistical Significance is used to evaluate the trend<br>over 4 to 10 periods of measure, subject to data availability and comparability.
County: Washtenaw Recognized Carcinogens Released into Air
County: Washtenaw Recognized Carcinogens Released into Air
19,210
Pounds
(2022)
Compared to:
Prior Value
(33,053)
Prior Value compares a measured value with the previously measured value. Confidence intervals were not taken into account in determining the direction of the comparison.
Trend
This comparison measures the indicator’s values over multiple time periods.<br>The Mann-Kendall Test for Statistical Significance is used to evaluate the trend<br>over 4 to 10 periods of measure, subject to data availability and comparability.
County: Washtenaw
Environmental Health / Built Environment
Value
Compared to:
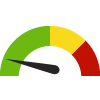
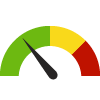
County: Washtenaw Proximity to Highways
County: Washtenaw Proximity to Highways
6.2%
(2020)
Compared to:

MI Counties
The distribution is based on data from 83 Michigan counties.
MI Value
(5.7%)
The regional value is compared to the Michigan State value.
Prior Value
(6.4%)
Prior Value compares a measured value with the previously measured value. Confidence intervals were not taken into account in determining the direction of the comparison.
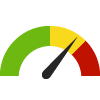
County: Washtenaw Access to Parks
County: Washtenaw Access to Parks
75.5%
(2020)
Compared to:
MI Counties
The distribution is based on data from 83 Michigan counties.
MI Value
(73.8%)
The regional value is compared to the Michigan State value.
Prior Value
(52.2%)
Prior Value compares a measured value with the previously measured value. Confidence intervals were not taken into account in determining the direction of the comparison.
County: Washtenaw
Environmental Health / Toxins & Contaminants
Value
Compared to:
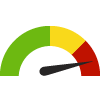
County: Washtenaw Houses Built Prior to 1950
County: Washtenaw Houses Built Prior to 1950
16.2%
(2018-2022)
Compared to:
MI Counties
The distribution is based on data from 83 Michigan counties.
U.S. Counties
The distribution is based on data from 3,133 U.S. counties and county equivalents.
MI Value
(21.6%)
The regional value is compared to the Michigan State value.
US Value
(16.7%)
The regional value is compared to the national value.
Trend
This comparison measures the indicator’s values over multiple time periods.<br>The Mann-Kendall Test for Statistical Significance is used to evaluate the trend<br>over 4 to 10 periods of measure, subject to data availability and comparability.
County: Washtenaw PBT Released
County: Washtenaw PBT Released
1
Pounds
(2022)
Compared to:

Prior Value
(1)
Prior Value compares a measured value with the previously measured value. Confidence intervals were not taken into account in determining the direction of the comparison.
Trend
This comparison measures the indicator’s values over multiple time periods.<br>The Mann-Kendall Test for Statistical Significance is used to evaluate the trend<br>over 4 to 10 periods of measure, subject to data availability and comparability.
County: Washtenaw
Environmental Health / Weather & Climate
Value
Compared to:
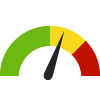
County: Washtenaw Number of Extreme Heat Days
County: Washtenaw Number of Extreme Heat Days
19
Days
(2021)
Compared to:
Prior Value
(24)
Prior Value compares a measured value with the previously measured value. Confidence intervals were not taken into account in determining the direction of the comparison.
Trend
This comparison measures the indicator’s values over multiple time periods.<br>The Mann-Kendall Test for Statistical Significance is used to evaluate the trend<br>over 4 to 10 periods of measure, subject to data availability and comparability.
County: Washtenaw Number of Extreme Heat Events
County: Washtenaw Number of Extreme Heat Events
15
Events
(2021)
Compared to:
Prior Value
(21)
Prior Value compares a measured value with the previously measured value. Confidence intervals were not taken into account in determining the direction of the comparison.
Trend
This comparison measures the indicator’s values over multiple time periods.<br>The Mann-Kendall Test for Statistical Significance is used to evaluate the trend<br>over 4 to 10 periods of measure, subject to data availability and comparability.
County: Washtenaw Number of Extreme Precipitation Days
County: Washtenaw Number of Extreme Precipitation Days
29
Days
(2021)
Compared to:

Prior Value
(27)
Prior Value compares a measured value with the previously measured value. Confidence intervals were not taken into account in determining the direction of the comparison.
Trend
This comparison measures the indicator’s values over multiple time periods.<br>The Mann-Kendall Test for Statistical Significance is used to evaluate the trend<br>over 4 to 10 periods of measure, subject to data availability and comparability.
County: Washtenaw Weeks of Moderate Drought or Worse
County: Washtenaw Weeks of Moderate Drought or Worse
14
Weeks per year
(2021)
Compared to:
Prior Value
Prior Value compares a measured value with the previously measured value. Confidence intervals were not taken into account in determining the direction of the comparison.
Trend
This comparison measures the indicator’s values over multiple time periods.<br>The Mann-Kendall Test for Statistical Significance is used to evaluate the trend<br>over 4 to 10 periods of measure, subject to data availability and comparability.
