Indicator Gauge Icon Legend
Legend Colors
Red is bad, green is good, blue is not statistically different/neutral.
Compared to Distribution
 the value is in the best half of communities.
 the value is in the 2nd worst quarter of communities.
 the value is in the worst quarter of communities.
Compared to Target
 meets target;
  does not meet target.
Compared to a Single Value
 lower than the comparison value;
 higher than the comparison value;
 not statistically different from comparison value.
Trend

 non-significant change over time;
 significant change over time;
  no change over time.
Compared to Prior Value
 higher than the previous measurement period;
 lower than the previous measurement period;
 no statistically different change from previous measurement period.
 Significantly better than the overall value
 Significantly worse than the overall value
 No significant difference with the overall value
 No data on significance available
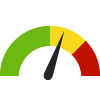
Children Enrolled in Medicaid who Visited the Dentist the Past Year
This indicator is archived and is no longer being updated. Click to learn more
This indicator shows the percentage of Medicaid-enrolled children 2-17 years who were able to visit the dentist at least once in the previous year. These rates are compiled from Medicaid billing information.
Why is this important?
Poor oral health is associated with additional health risks. Individuals living in poverty are less likely to visit the dentist, due in part to low Medicaid reimbursement for dentists. Healthy Kids Dental insurance (HKD) covers children enrolled in Medicaid, and increases reimbursement rates for dentists, however, visit rates for children living in low-income households still remain lower than visit rates for children overall. Additionally, rates in children on HKD lag behind the target set by MDHHS (70% of children on HKD visit the dentist in a year).
Several programs were implemented between 2013 and 2016 to increase visits for low-income individuals, including the HKD insurance expansion and the installation of a community dental clinic in Washtenaw County.
County: Washtenaw
49.1%
%
Source:
MDHHS Medicaid Office
Measurement period: 2022
Maintained by: Washtenaw County Health Department
Last update: September 2023
Measurement period: 2022
Maintained by: Washtenaw County Health Department
Last update: September 2023
Filter(s) for this location: State: Michigan
Compared to

Graph Selections

View maps, graphs, and tables for this indicator by selecting other location types (above).
Data Source
- MDHHS Medicaid Office
Maintained By: Washtenaw County Health Department
Filed under: Health / Oral Health, Health / Health Care Access & Quality, Health Behaviors, Health Outcomes, Children, Teens