Indicator Gauge Icon Legend
Legend Colors
Red is bad, green is good, blue is not statistically different/neutral.
Compared to Distribution
 the value is in the best half of communities.
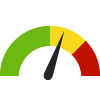 the value is in the 2nd worst quarter of communities.
 the value is in the worst quarter of communities.
Compared to Target
 meets target;
  does not meet target.
Compared to a Single Value
 lower than the comparison value;
 higher than the comparison value;
 not statistically different from comparison value.
Trend

 non-significant change over time;
 significant change over time;
  no change over time.
Compared to Prior Value
 higher than the previous measurement period;
 lower than the previous measurement period;
 no statistically different change from previous measurement period.
 Significantly better than the overall value
 Significantly worse than the overall value
 No significant difference with the overall value
 No data on significance available
Teens who Felt Sad or Hopeless Every Day for the Past 2 Weeks; 9th, 11th Graders
Measurement Period: 2022
This indicator is archived and is no longer being updated. Click to learn more
This indicator shows students who felt so sad or hopeless almost every day for two weeks or more in a row that they stopped doing some usual activities during the past 12 months.
Why is this important?
Psychological distress can affect all aspects of our lives. Depression among young adults is a complex problem. characterized by deep disparities across groups. Adolescents who experience depression during their youth are more likely to experience mental health illnesses in adulthood and may suffer additional adverse outcomes along the way.
It is important to recognize and address potential psychological issues before they become critical, or before they lead to suicide completion. Occasional down days are normal, but persistent mental/emotional health problems should be evaluated and treated by a qualified professional. Social conditions can also influence mental health risks and outcome, bot positively and negatively.
County: Washtenaw
37.6%
Source:
Michigan Profile for Healthy Youth
Measurement period: 2022
Maintained by: Conduent Healthy Communities Institute
Last update: December 2022
Measurement period: 2022
Maintained by: Conduent Healthy Communities Institute
Last update: December 2022
Filter(s) for this location: State: Michigan
Compared to


Graph Selections

Data Source
- Michigan Profile for Healthy Youth
Maintained By: Conduent Healthy Communities Institute (Methodology)
Filed under: Health / Mental Health & Mental Disorders, Health Status, Teens