Search for Indicators
Mental Health Dashboard
This dashboard shows data related to mental health in Washtenaw County. Data contained within this dashboard provides information on aspects of mental health that span across all age groups of the local population, as well as additional age-specific information on youth mental health (i.e. Teens who Felt Sad or Hopeless Every Day for the Past 2 Weeks) and mental health among older adults (i.e. Depression: Medicare Population).
- List of local mental health resources
- Washtenaw Alliance for Children and Youth (WACY) Annual Reports
- Michigan School Health Survey System Data Portal
- Michigan Profile for Healthy Youth (MiPHY)
- Youth Risk Behavior Surveillance System (YRBSS)
- MyVoice Mental Health Research
- Substance Abuse and Mental Health Data Archive (SAMHDA) Interactive Tool
- Washtenaw County Community Mental Health (CMH) Annual Report: 2019/2020
- Washtenaw County Annual Suicide Report: 2023
Indicator Gauge Icon Legend
Legend Colors
Red is bad, green is good, blue is not statistically different/neutral.
Compared to Distribution
 the value is in the best half of communities.
 the value is in the 2nd worst quarter of communities.
 the value is in the worst quarter of communities.
Compared to Target
 meets target;
  does not meet target.
Compared to a Single Value
 lower than the comparison value;
 higher than the comparison value;
 not statistically different from comparison value.
Trend

 non-significant change over time;
 significant change over time;
  no change over time.
Compared to Prior Value
 higher than the previous measurement period;
 lower than the previous measurement period;
 no statistically different change from previous measurement period.
County: Washtenaw
Health / Disabilities
Value
Compared to:
County: Washtenaw Persons with a Cognitive Difficulty
County: Washtenaw Persons with a Cognitive Difficulty
4.6%
(2018-2022)
Compared to:


MI Value
(6.0%)
The regional value is compared to the Michigan State value.
US Value
(5.3%)
The regional value is compared to the national value.
Trend
This comparison measures the indicator’s values over multiple time periods.<br>The Mann-Kendall Test for Statistical Significance is used to evaluate the trend<br>over 4 to 10 periods of measure, subject to data availability and comparability.
County: Washtenaw
Health / Mental Health & Mental Disorders
Value
Compared to:
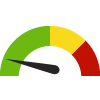
County: Washtenaw Age-Adjusted Death Rate due to Suicide
County: Washtenaw Age-Adjusted Death Rate due to Suicide
11.2
Deaths per 100,000 population
(2018-2022)
Compared to:

MI Counties
The distribution is based on data from 61 Michigan counties.
MI Value
(14.4)
The regional value is compared to the Michigan State value.
US Value
(13.5 in 2020)
The regional value is compared to the national value. The source for the national value is Centers for Disease Control and Prevention
Prior Value
(11.4)
Prior Value compares a measured value with the previously measured value. Confidence intervals were taken into account in determining the direction of the comparison.
Trend
This comparison measures the indicator’s values over multiple time periods.<br>The Mann-Kendall Test for Statistical Significance is used to evaluate the trend<br>over 4 to 10 periods of measure, subject to data availability and comparability.
HP 2030 Target
(12.8)
<div>MHMD-01: Reduce the suicide rate <strong>(LEADING HEALTH INDICATOR)</strong></div>
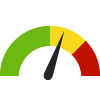
County: Washtenaw Depression: Medicare Population
County: Washtenaw Depression: Medicare Population
19.0%
(2022)
Compared to:

MI Counties
The distribution is based on data from 83 Michigan counties.
U.S. Counties
The distribution is based on data from 3,129 U.S. counties and county equivalents.
MI Value
(18.0%)
The regional value is compared to the Michigan State value.
US Value
(16.0%)
The regional value is compared to the national value.
Prior Value
(19.0%)
Prior Value compares a measured value with the previously measured value. Confidence intervals were not taken into account in determining the direction of the comparison.
Trend
This comparison measures the indicator’s values over multiple time periods.<br>The Mann-Kendall Test for Statistical Significance is used to evaluate the trend<br>over 4 to 10 periods of measure, subject to data availability and comparability.
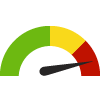
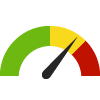
County: Washtenaw Mental Health Provider Rate
County: Washtenaw Mental Health Provider Rate
714
Providers per 100,000 population
(2023)
Compared to:
MI Counties
The distribution is based on data from 83 Michigan counties.
U.S. Counties
The distribution is based on data from 2,956 U.S. counties and county equivalents.
MI Value
(336)
The regional value is compared to the Michigan State value.
Prior Value
(652)
Prior Value compares a measured value with the previously measured value. Confidence intervals were not taken into account in determining the direction of the comparison.
Trend
This comparison measures the indicator’s values over multiple time periods.<br>The Mann-Kendall Test for Statistical Significance is used to evaluate the trend<br>over 4 to 10 periods of measure, subject to data availability and comparability.
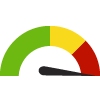
County: Washtenaw Poor Mental Health: 14+ Days
County: Washtenaw Poor Mental Health: 14+ Days
15.5%
(2020-2022)
Compared to:

MI Value
(16.0%)
The regional value is compared to the Michigan State value.
Prior Value
(16.2%)
Prior Value compares a measured value with the previously measured value. Confidence intervals were not taken into account in determining the direction of the comparison.
Trend
This comparison measures the indicator’s values over multiple time periods.<br>The Mann-Kendall Test for Statistical Significance is used to evaluate the trend<br>over 4 to 10 periods of measure, subject to data availability and comparability.
County: Washtenaw Suicide Completions
County: Washtenaw Suicide Completions
44
Number of completions
(2022)
Compared to:
Prior Value
(47)
Prior Value compares a measured value with the previously measured value. Confidence intervals were not taken into account in determining the direction of the comparison.
Trend
This comparison measures the indicator’s values over multiple time periods.<br>The Mann-Kendall Test for Statistical Significance is used to evaluate the trend<br>over 4 to 10 periods of measure, subject to data availability and comparability.
37.6%
(2022)
Compared to:

MI Value
(36.4% in 2020)
The regional value is compared to the 2019 Michigan state value for 9th - 12th graders.
Prior Value
(31.5%)
Prior Value compares a measured value with the previously measured value. Confidence intervals were not taken into account in determining the direction of the comparison.
Trend
This comparison measures the indicator’s values over multiple time periods.<br>The Mann-Kendall Test for Statistical Significance is used to evaluate the trend<br>over 4 to 10 periods of measure, subject to data availability and comparability.
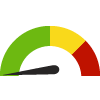
County: Washtenaw Adults Ever Diagnosed with Depression
County: Washtenaw Adults Ever Diagnosed with Depression
26.1%
(2021)
Compared to:
MI Counties
The distribution is based on data from 83 Michigan counties.
U.S. Counties
The distribution is based on data from 3,074 U.S. counties and county equivalents.
US Value
(19.5%)
The regional value is compared to the national value.
