Search for Indicators
Demographics Dashboard
Description of Washtenaw County
Washtenaw County is located in southeast Michigan, covering an area of 720 square miles. The largest cities in Washtenaw County are Ann Arbor and Ypsilanti. The county also contains several smaller cities/villages, such as Chelsea, Dexter, Manchester, Milan, Saline, and Whitmore Lake. Outside of these city areas much of the county is rural. Washtenaw County is home to two large universities – the University of Michigan in Ann Arbor and Eastern Michigan University in Ypsilanti
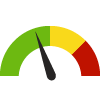
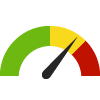
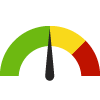
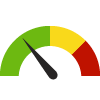
Indicator Gauge Icon Legend
Legend Colors
Red is bad, green is good, blue is not statistically different/neutral.
Compared to Distribution
 the value is in the best half of communities.
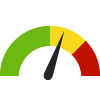 the value is in the 2nd worst quarter of communities.
 the value is in the worst quarter of communities.
Compared to Target
 meets target;
  does not meet target.
Compared to a Single Value
 lower than the comparison value;
 higher than the comparison value;
 not statistically different from comparison value.
Trend

 non-significant change over time;
 significant change over time;
  no change over time.
Compared to Prior Value
 higher than the previous measurement period;
 lower than the previous measurement period;
 no statistically different change from previous measurement period.
Census Tract: 26161407400
Population Characteristics
Value
Compared to:
Census Tract: 26161407400 Veteran Population
Census Tract: 26161407400 Veteran Population
6.2%
(2018-2022)
Compared to:


Washtenaw, MI County Value
(4.3%)
The regional value is compared to the Washtenaw County value.
Trend
This comparison measures the indicator’s values over multiple time periods.<br>The Mann-Kendall Test for Statistical Significance is used to evaluate the trend<br>over 4 to 10 periods of measure, subject to data availability and comparability.
Census Tract: 26161407400 Foreign Born Persons
Census Tract: 26161407400 Foreign Born Persons
13.6%
(2018-2022)
Compared to:
Washtenaw, MI County Value
(12.4%)
The regional value is compared to the Washtenaw County value.
Census Tract: 26161407400
Housing
Value
Compared to:
Census Tract: 26161407400 Homeownership
Census Tract: 26161407400 Homeownership
71.1%
(2018-2022)
Compared to:
MI Census Tracts
The distribution is based on data from 2,896 Michigan census tracts.
U.S. Census Tracts
The distribution is based on data from 82,515 U.S. census tracts.
Washtenaw, MI County Value
(58.0%)
The regional value is compared to the Washtenaw County value.
Trend
This comparison measures the indicator’s values over multiple time periods.<br>The Mann-Kendall Test for Statistical Significance is used to evaluate the trend<br>over 4 to 10 periods of measure, subject to data availability and comparability.
Census Tract: 26161407400 Median Housing Unit Value
Census Tract: 26161407400 Median Housing Unit Value
$116,000
(2018-2022)
Compared to:


MI Census Tracts
The distribution is based on data from 2,828 Michigan census tracts.
Washtenaw, MI County Value
($336,300)
The regional value is compared to the Washtenaw County value.
Trend
This comparison measures the indicator’s values over multiple time periods.<br>The Mann-Kendall Test for Statistical Significance is used to evaluate the trend<br>over 4 to 10 periods of measure, subject to data availability and comparability.
Census Tract: 26161407400 Mortgaged Owners Median Monthly Household Costs
Census Tract: 26161407400 Mortgaged Owners Median Monthly Household Costs
$1,451
(2018-2022)
Compared to:
MI Census Tracts
The distribution is based on data from 2,811 Michigan census tracts.
Washtenaw, MI County Value
($2,015)
The regional value is compared to the Washtenaw County value.
Trend
This comparison measures the indicator’s values over multiple time periods.<br>The Mann-Kendall Test for Statistical Significance is used to evaluate the trend<br>over 4 to 10 periods of measure, subject to data availability and comparability.
Census Tract: 26161407400 Median Monthly Owner Costs for Households without a Mortgage
Census Tract: 26161407400 Median Monthly Owner Costs for Households without a Mortgage
$690
(2018-2022)
Compared to:

MI Census Tracts
The distribution is based on data from 2,822 Michigan census tracts.
Washtenaw, MI County Value
($832)
The regional value is compared to the Washtenaw County value.
Trend
This comparison measures the indicator’s values over multiple time periods.<br>The Mann-Kendall Test for Statistical Significance is used to evaluate the trend<br>over 4 to 10 periods of measure, subject to data availability and comparability.
Census Tract: 26161407400 Median Household Gross Rent
Census Tract: 26161407400 Median Household Gross Rent
$1,436
(2018-2022)
Compared to:


MI Census Tracts
The distribution is based on data from 2,672 Michigan census tracts.
Washtenaw, MI County Value
($1,335)
The regional value is compared to the Washtenaw County value.
Trend
This comparison measures the indicator’s values over multiple time periods.<br>The Mann-Kendall Test for Statistical Significance is used to evaluate the trend<br>over 4 to 10 periods of measure, subject to data availability and comparability.
Census Tract: 26161407400
Family & Living Arrangements
Value
Compared to:
Census Tract: 26161407400 Households
Census Tract: 26161407400 Households
2,430
Households
(2018-2022)
Compared to:

Trend
This comparison measures the indicator’s values over multiple time periods.<br>The Mann-Kendall Test for Statistical Significance is used to evaluate the trend<br>over 4 to 10 periods of measure, subject to data availability and comparability.
Census Tract: 26161407400 Average Household Size
Census Tract: 26161407400 Average Household Size
2.60
Persons per household
(2018-2022)
Compared to:

Washtenaw, MI County Value
(2.40)
The regional value is compared to the Washtenaw County value.
Trend
This comparison measures the indicator’s values over multiple time periods.<br>The Mann-Kendall Test for Statistical Significance is used to evaluate the trend<br>over 4 to 10 periods of measure, subject to data availability and comparability.
Census Tract: 26161407400 Population Age 5+ with Language Other than English Spoken at Home
Census Tract: 26161407400 Population Age 5+ with Language Other than English Spoken at Home
11.8%
(2018-2022)
Compared to:

Washtenaw, MI County Value
(15.1%)
The regional value is compared to the Washtenaw County value.
Census Tract: 26161407400
Education
Value
Compared to:
Census Tract: 26161407400 People 25+ with a High School Diploma or Higher
Census Tract: 26161407400 People 25+ with a High School Diploma or Higher
89.2%
(2018-2022)
Compared to:
MI Census Tracts
The distribution is based on data from 2,913 Michigan census tracts.
U.S. Census Tracts
The distribution is based on data from 82,720 U.S. census tracts.
Washtenaw, MI County Value
(95.8%)
The regional value is compared to the Washtenaw County value.
Trend
This comparison measures the indicator’s values over multiple time periods.<br>The Mann-Kendall Test for Statistical Significance is used to evaluate the trend<br>over 4 to 10 periods of measure, subject to data availability and comparability.
Census Tract: 26161407400 People 25+ with a Bachelor's Degree or Higher
Census Tract: 26161407400 People 25+ with a Bachelor's Degree or Higher
26.3%
(2018-2022)
Compared to:
MI Census Tracts
The distribution is based on data from 2,913 Michigan census tracts.
U.S. Census Tracts
The distribution is based on data from 82,720 U.S. census tracts.
Washtenaw, MI County Value
(57.4%)
The regional value is compared to the Washtenaw County value.
Trend
This comparison measures the indicator’s values over multiple time periods.<br>The Mann-Kendall Test for Statistical Significance is used to evaluate the trend<br>over 4 to 10 periods of measure, subject to data availability and comparability.
Census Tract: 26161407400
Health
Value
Compared to:
Census Tract: 26161407400 Persons with a Disability
Census Tract: 26161407400 Persons with a Disability
16.0%
(2018-2022)
Compared to:
Washtenaw, MI County Value
(10.1%)
The regional value is compared to the Washtenaw County value.
Trend
This comparison measures the indicator’s values over multiple time periods.<br>The Mann-Kendall Test for Statistical Significance is used to evaluate the trend<br>over 4 to 10 periods of measure, subject to data availability and comparability.
Census Tract: 26161407400
Economy
Value
Compared to:
Census Tract: 26161407400 Population 16+ in Civilian Labor Force
Census Tract: 26161407400 Population 16+ in Civilian Labor Force
48.4%
(2018-2022)
Compared to:

MI Census Tracts
The distribution is based on data from 2,913 Michigan census tracts.
U.S. Census Tracts
The distribution is based on data from 82,741 U.S. census tracts.
Washtenaw, MI County Value
(60.7%)
The regional value is compared to the Washtenaw County value.
Trend
This comparison measures the indicator’s values over multiple time periods.<br>The Mann-Kendall Test for Statistical Significance is used to evaluate the trend<br>over 4 to 10 periods of measure, subject to data availability and comparability.
Census Tract: 26161407400 Female Population 16+ in Civilian Labor Force
Census Tract: 26161407400 Female Population 16+ in Civilian Labor Force
61.0%
(2018-2022)
Compared to:
MI Census Tracts
The distribution is based on data from 2,907 Michigan census tracts.
U.S. Census Tracts
The distribution is based on data from 82,647 U.S. census tracts.
Washtenaw, MI County Value
(60.0%)
The regional value is compared to the Washtenaw County value.
Trend
This comparison measures the indicator’s values over multiple time periods.<br>The Mann-Kendall Test for Statistical Significance is used to evaluate the trend<br>over 4 to 10 periods of measure, subject to data availability and comparability.
Census Tract: 26161407400
Transportation
Value
Compared to:
Census Tract: 26161407400 Mean Travel Time to Work
Census Tract: 26161407400 Mean Travel Time to Work
27.9
Minutes
(2018-2022)
Compared to:
MI Census Tracts
The distribution is based on data from 2,895 Michigan census tracts.
U.S. Census Tracts
The distribution is based on data from 82,376 U.S. census tracts.
Washtenaw, MI County Value
(23.6)
The regional value is compared to the Washtenaw County value.
Trend
This comparison measures the indicator’s values over multiple time periods.<br>The Mann-Kendall Test for Statistical Significance is used to evaluate the trend<br>over 4 to 10 periods of measure, subject to data availability and comparability.
Census Tract: 26161407400
Income & Poverty
Value
Compared to:
Census Tract: 26161407400 Median Household Income
Census Tract: 26161407400 Median Household Income
$57,688
(2018-2022)
Compared to:
MI Census Tracts
The distribution is based on data from 2,867 Michigan census tracts.
U.S. Census Tracts
The distribution is based on data from 81,653 U.S. census tracts.
Washtenaw, MI County Value
($84,245)
The regional value is compared to the Washtenaw County value.
Trend
This comparison measures the indicator’s values over multiple time periods.<br>The Mann-Kendall Test for Statistical Significance is used to evaluate the trend<br>over 4 to 10 periods of measure, subject to data availability and comparability.
Census Tract: 26161407400 Per Capita Income
Census Tract: 26161407400 Per Capita Income
$28,334
(2018-2022)
Compared to:
MI Census Tracts
The distribution is based on data from 2,910 Michigan census tracts.
U.S. Census Tracts
The distribution is based on data from 82,680 U.S. census tracts.
Washtenaw, MI County Value
($49,568)
The regional value is compared to the Washtenaw County value.
Trend
This comparison measures the indicator’s values over multiple time periods.<br>The Mann-Kendall Test for Statistical Significance is used to evaluate the trend<br>over 4 to 10 periods of measure, subject to data availability and comparability.
Census Tract: 26161407400 People Living Below Poverty Level
Census Tract: 26161407400 People Living Below Poverty Level
20.6%
(2018-2022)
Compared to:
MI Census Tracts
The distribution is based on data from 2,897 Michigan census tracts.
U.S. Census Tracts
The distribution is based on data from 82,546 U.S. census tracts.
Washtenaw, MI County Value
(13.8%)
The regional value is compared to the Washtenaw County value.
Trend
This comparison measures the indicator’s values over multiple time periods.<br>The Mann-Kendall Test for Statistical Significance is used to evaluate the trend<br>over 4 to 10 periods of measure, subject to data availability and comparability.
HP 2030 Target
(8.0%)
