Search for Indicators
All Data
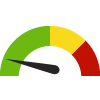
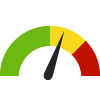
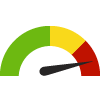
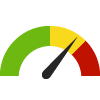
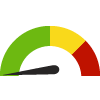
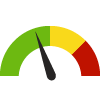
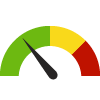
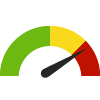
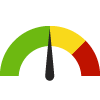
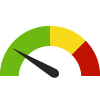
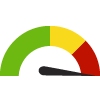
Indicator Gauge Icon Legend
Legend Colors
Red is bad, green is good, blue is not statistically different/neutral.
Compared to Distribution
 the value is in the best half of communities.
 the value is in the 2nd worst quarter of communities.
 the value is in the worst quarter of communities.
Compared to Target
 meets target;
  does not meet target.
Compared to a Single Value
 lower than the comparison value;
 higher than the comparison value;
 not statistically different from comparison value.
Trend

 non-significant change over time;
 significant change over time;
  no change over time.
Compared to Prior Value
 higher than the previous measurement period;
 lower than the previous measurement period;
 no statistically different change from previous measurement period.
County: Washtenaw
Health / Respiratory Diseases
Value
Compared to:
County: Washtenaw Asthma: Medicare Population
County: Washtenaw Asthma: Medicare Population
7.0%
(2022)
Compared to:
MI Counties
The distribution is based on data from 83 Michigan counties.
U.S. Counties
The distribution is based on data from 3,129 U.S. counties and county equivalents.
MI Value
(7.0%)
The regional value is compared to the Michigan State value.
US Value
(7.0%)
The regional value is compared to the national value.
Prior Value
(7.0%)
Prior Value compares a measured value with the previously measured value. Confidence intervals were not taken into account in determining the direction of the comparison.
Trend
This comparison measures the indicator’s values over multiple time periods.<br>The Mann-Kendall Test for Statistical Significance is used to evaluate the trend<br>over 4 to 10 periods of measure, subject to data availability and comparability.
County: Washtenaw COPD: Medicare Population
County: Washtenaw COPD: Medicare Population
8.0%
(2022)
Compared to:
MI Counties
The distribution is based on data from 83 Michigan counties.
U.S. Counties
The distribution is based on data from 3,129 U.S. counties and county equivalents.
MI Value
(13.0%)
The regional value is compared to the Michigan State value.
US Value
(11.0%)
The regional value is compared to the national value.
Prior Value
(8.0%)
Prior Value compares a measured value with the previously measured value. Confidence intervals were not taken into account in determining the direction of the comparison.
Trend
This comparison measures the indicator’s values over multiple time periods.<br>The Mann-Kendall Test for Statistical Significance is used to evaluate the trend<br>over 4 to 10 periods of measure, subject to data availability and comparability.
County: Washtenaw Teens with Asthma
County: Washtenaw Teens with Asthma
20.6%
(2022)
Compared to:

MI Value
(24.2% in 2020)
The regional value is compared to the 2019 Michigan state value for 9th - 12th graders.
Prior Value
(19.5%)
Prior Value compares a measured value with the previously measured value. Confidence intervals were not taken into account in determining the direction of the comparison.
Trend
This comparison measures the indicator’s values over multiple time periods.<br>The Mann-Kendall Test for Statistical Significance is used to evaluate the trend<br>over 4 to 10 periods of measure, subject to data availability and comparability.
County: Washtenaw
Health / Sexually Transmitted Infections
Value
Compared to:
County: Washtenaw Chlamydia Incidence Rate
County: Washtenaw Chlamydia Incidence Rate
426
Cases per 100,000 population
(2020)
Compared to:

MI Counties
The distribution is based on data from 52 Michigan counties.
MI Value
(449)
The regional value is compared to the Michigan State value.
US Value
(481.3)
The regional value is compared to the national value. The source for the national value is National Center for HIV/AIDS, Viral Hepatitis, STD, and TB Prevention
Prior Value
(491)
Prior Value compares a measured value with the previously measured value. Confidence intervals were not taken into account in determining the direction of the comparison.
Trend
This comparison measures the indicator’s values over multiple time periods.<br>The Mann-Kendall Test for Statistical Significance is used to evaluate the trend<br>over 4 to 10 periods of measure, subject to data availability and comparability.
County: Washtenaw Gonorrhea Incidence Rate
County: Washtenaw Gonorrhea Incidence Rate
168
Cases per 100,000 population
(2020)
Compared to:

MI Value
(234)
The regional value is compared to the Michigan State value.
US Value
(206.5)
The regional value is compared to the national value. The source for the national value is National Center for HIV/AIDS, Viral Hepatitis, STD, and TB Prevention
Prior Value
(156)
Prior Value compares a measured value with the previously measured value. Confidence intervals were not taken into account in determining the direction of the comparison.
Trend
This comparison measures the indicator’s values over multiple time periods.<br>The Mann-Kendall Test for Statistical Significance is used to evaluate the trend<br>over 4 to 10 periods of measure, subject to data availability and comparability.
County: Washtenaw HIV Prevalence Rate
County: Washtenaw HIV Prevalence Rate
186.2
Cases per 100,000 population
(2021)
Compared to:


MI Value
(202.6)
The regional value is compared to the Michigan State value.
US Value
(382.2)
The regional value is compared to the national value.
Prior Value
(189.0)
Prior Value compares a measured value with the previously measured value. Confidence intervals were not taken into account in determining the direction of the comparison.
Trend
This comparison measures the indicator’s values over multiple time periods.<br>The Mann-Kendall Test for Statistical Significance is used to evaluate the trend<br>over 4 to 10 periods of measure, subject to data availability and comparability.
County: Washtenaw
Health / Tobacco Use
Value
Compared to:
County: Washtenaw Adults who Smoke
County: Washtenaw Adults who Smoke
9.2%
(2020-2022)
Compared to:
MI Value
(16.9%)
The regional value is compared to the Michigan State value.
US Value
(14.0% in 2022)
The regional value is compared to the national value. The source for the national value is Behavioral Risk Factor Surveillance System
Prior Value
(9.6%)
Prior Value compares a measured value with the previously measured value. Confidence intervals were not taken into account in determining the direction of the comparison.
Trend
This comparison measures the indicator’s values over multiple time periods.<br>The Mann-Kendall Test for Statistical Significance is used to evaluate the trend<br>over 4 to 10 periods of measure, subject to data availability and comparability.
HP 2030 Target
(6.1%)
<div>TU-02: Reduce current cigarette smoking in adults <strong>(LEADING HEALTH INDICATOR)</strong></div>
County: Washtenaw Adults who Used to Smoke
County: Washtenaw Adults who Used to Smoke
20.1%
(2020-2022)
Compared to:


MI Value
(26.5%)
The regional value is compared to the Michigan State value.
Prior Value
(19.3%)
Prior Value compares a measured value with the previously measured value. Confidence intervals were not taken into account in determining the direction of the comparison.
Trend
This comparison measures the indicator’s values over multiple time periods.<br>The Mann-Kendall Test for Statistical Significance is used to evaluate the trend<br>over 4 to 10 periods of measure, subject to data availability and comparability.
County: Washtenaw Teens who Smoke: 9th, 11th Graders
County: Washtenaw Teens who Smoke: 9th, 11th Graders
1.0%
(2022)
Compared to:
MI Value
(4.5% in 2020)
The regional value is compared to the 2019 Michigan state value for 9th - 12th graders.
Prior Value
(2.6%)
Prior Value compares a measured value with the previously measured value. Confidence intervals were not taken into account in determining the direction of the comparison.
Trend
This comparison measures the indicator’s values over multiple time periods.<br>The Mann-Kendall Test for Statistical Significance is used to evaluate the trend<br>over 4 to 10 periods of measure, subject to data availability and comparability.
County: Washtenaw Teens who Used E-cigarettes: 9th, 11th Graders
County: Washtenaw Teens who Used E-cigarettes: 9th, 11th Graders
9.4%
(2022)
Compared to:
MI Value
(20.8% in 2020)
The regional value is compared to the 2019 Michigan state value for 9th - 12th graders.
Prior Value
(15.5%)
Prior Value compares a measured value with the previously measured value. Confidence intervals were not taken into account in determining the direction of the comparison.
Trend
This comparison measures the indicator’s values over multiple time periods.<br>The Mann-Kendall Test for Statistical Significance is used to evaluate the trend<br>over 4 to 10 periods of measure, subject to data availability and comparability.
County: Washtenaw
Health / Weight Status
Value
Compared to:
County: Washtenaw Adults Who Are Obese
County: Washtenaw Adults Who Are Obese
27.3%
(2020-2022)
Compared to:
MI Value
(34.7%)
The regional value is compared to the Michigan State value.
US Value
(33.6% in 2022)
The regional value is compared to the national value. The source for the national value is Behavioral Risk Factor Surveillance System
Prior Value
(27.3%)
Prior Value compares a measured value with the previously measured value. Confidence intervals were not taken into account in determining the direction of the comparison.
Trend
This comparison measures the indicator’s values over multiple time periods.<br>The Mann-Kendall Test for Statistical Significance is used to evaluate the trend<br>over 4 to 10 periods of measure, subject to data availability and comparability.
County: Washtenaw Adults who are Overweight
County: Washtenaw Adults who are Overweight
30.1%
(2020-2022)
Compared to:
MI Value
(33.9%)
The regional value is compared to the Michigan State value.
US Value
(34.1% in 2022)
The regional value is compared to the national value. The source for the national value is Behavioral Risk Factor Surveillance System
Prior Value
(32.2%)
Prior Value compares a measured value with the previously measured value. Confidence intervals were not taken into account in determining the direction of the comparison.
Trend
This comparison measures the indicator’s values over multiple time periods.<br>The Mann-Kendall Test for Statistical Significance is used to evaluate the trend<br>over 4 to 10 periods of measure, subject to data availability and comparability.
County: Washtenaw Children Who Are Obese
County: Washtenaw Children Who Are Obese
11.8%
% of children ages 2-17 yrs
(2017)
Compared to:
Prior Value
(11.4%)
Prior Value compares a measured value with the previously measured value. Confidence intervals were not taken into account in determining the direction of the comparison.
Trend
This comparison measures the indicator’s values over multiple time periods.<br>The Mann-Kendall Test for Statistical Significance is used to evaluate the trend<br>over 4 to 10 periods of measure, subject to data availability and comparability.
HP 2020 Target
(14.5%)
HP 2030 Target
(15.5%)
<div>The national Healthy People 2030 target is for children and adolescents aged 2-19 years. </div>
County: Washtenaw Teens who are Obese: 9th, 11th Graders
County: Washtenaw Teens who are Obese: 9th, 11th Graders
9.4%
(2022)
Compared to:
MI Value
(15.3% in 2020)
The regional value is compared to the 2019 Michigan state value for 9th - 12th graders.
Prior Value
(10.9%)
Prior Value compares a measured value with the previously measured value. Confidence intervals were not taken into account in determining the direction of the comparison.
Trend
This comparison measures the indicator’s values over multiple time periods.<br>The Mann-Kendall Test for Statistical Significance is used to evaluate the trend<br>over 4 to 10 periods of measure, subject to data availability and comparability.
County: Washtenaw
Health / Wellness & Lifestyle
Value
Compared to:
County: Washtenaw Frequent Physical Distress
County: Washtenaw Frequent Physical Distress
10.5%
(2019)
Compared to:
MI Counties
The distribution is based on data from 83 Michigan counties.
U.S. Counties
The distribution is based on data from 3,121 U.S. counties and county equivalents.
MI Value
(13.2%)
The regional value is compared to the Michigan State value.
US Value
(12.0%)
The regional value is compared to the national value.
Prior Value
(10.8%)
Prior Value compares a measured value with the previously measured value. Confidence intervals were taken into account in determining the direction of the comparison.
County: Washtenaw Insufficient Sleep
County: Washtenaw Insufficient Sleep
33.8%
(2020)
Compared to:

MI Counties
The distribution is based on data from 83 Michigan counties.
U.S. Counties
The distribution is based on data from 3,140 U.S. counties and county equivalents.
MI Value
(35.5%)
The regional value is compared to the Michigan State value.
US Value
(33.0%)
The regional value is compared to the national value.
Prior Value
(36.6%)
Prior Value compares a measured value with the previously measured value. Confidence intervals were not taken into account in determining the direction of the comparison.
HP 2030 Target
(26.7%)
County: Washtenaw Limited Activity due to a Health Problem
County: Washtenaw Limited Activity due to a Health Problem
7.9%
(2020-2022)
Compared to:
MI Value
(9.7%)
The regional value is compared to the Michigan State value.
Prior Value
(7.8%)
Prior Value compares a measured value with the previously measured value. Confidence intervals were not taken into account in determining the direction of the comparison.
Trend
This comparison measures the indicator’s values over multiple time periods.<br>The Mann-Kendall Test for Statistical Significance is used to evaluate the trend<br>over 4 to 10 periods of measure, subject to data availability and comparability.
County: Washtenaw Poor Physical Health: 14+ Days
County: Washtenaw Poor Physical Health: 14+ Days
8.5%
(2021)
Compared to:
MI Counties
The distribution is based on data from 83 Michigan counties.
U.S. Counties
The distribution is based on data from 3,074 U.S. counties and county equivalents.
US Value
(10.9%)
The regional value is compared to the national value.
County: Washtenaw Poor Physical Health: Average Number of Days
County: Washtenaw Poor Physical Health: Average Number of Days
3.0
Days
(2021)
Compared to:
MI Counties
The distribution is based on data from 83 Michigan counties.
U.S. Counties
The distribution is based on data from 3,141 U.S. counties and county equivalents.
MI Value
(3.6)
The regional value is compared to the Michigan State value.
US Value
(3.3)
The regional value is compared to the national value.
Prior Value
(2.8)
Prior Value compares a measured value with the previously measured value. Confidence intervals were taken into account in determining the direction of the comparison.
Trend
This comparison measures the indicator’s values over multiple time periods.<br>The Mann-Kendall Test for Statistical Significance is used to evaluate the trend<br>over 4 to 10 periods of measure, subject to data availability and comparability.
County: Washtenaw Self-Reported General Health Assessment: Poor or Fair
County: Washtenaw Self-Reported General Health Assessment: Poor or Fair
10.8%
(2020-2022)
Compared to:
MI Value
(16.3%)
The regional value is compared to the Michigan State value.
US Value
(17.0% in 2022)
The regional value is compared to the national value. The source for the national value is Behavioral Risk Factor Surveillance System
Prior Value
(10.6%)
Prior Value compares a measured value with the previously measured value. Confidence intervals were not taken into account in determining the direction of the comparison.
Trend
This comparison measures the indicator’s values over multiple time periods.<br>The Mann-Kendall Test for Statistical Significance is used to evaluate the trend<br>over 4 to 10 periods of measure, subject to data availability and comparability.
County: Washtenaw
Community / Civic Engagement
Value
Compared to:
County: Washtenaw Registered Voters
County: Washtenaw Registered Voters
285,272
People
(2016)
Compared to:
Prior Value
(278,438)
Prior Value compares a measured value with the previously measured value. Confidence intervals were not taken into account in determining the direction of the comparison.
Trend
This comparison measures the indicator’s values over multiple time periods.<br>The Mann-Kendall Test for Statistical Significance is used to evaluate the trend<br>over 4 to 10 periods of measure, subject to data availability and comparability.
County: Washtenaw
Community / Crime & Crime Prevention
Value
Compared to:
County: Washtenaw Age-Adjusted Death Rate due to Homicide
County: Washtenaw Age-Adjusted Death Rate due to Homicide
3.2
Deaths per 100,000 population
(2018-2020)
Compared to:
U.S. Counties
The distribution is based on data from 495 U.S. counties and county equivalents.
MI Value
(7.2)
The regional value is compared to the Michigan State value.
US Value
(6.6)
The regional value is compared to the national value.
Prior Value
(3.3)
Prior Value compares a measured value with the previously measured value. Confidence intervals were taken into account in determining the direction of the comparison.
Trend
This comparison measures the indicator’s values over multiple time periods.<br>The Mann-Kendall Test for Statistical Significance is used to evaluate the trend<br>over 4 to 10 periods of measure, subject to data availability and comparability.
HP 2030 Target
(5.5)
<div>IVP-09: Reduce homicides <strong>(LEADING HEALTH INDICATOR)</strong></div>
County: Washtenaw Violent Crime Rate
County: Washtenaw Violent Crime Rate
303.1
Crimes per 100,000 population
(2014-2016)
Compared to:
MI Counties
The distribution is based on data from 81 Michigan counties.
MI Value
(443.2)
The regional value is compared to the Michigan State value.
US Value
(386.5)
The regional value is compared to the national value.
Prior Value
(298.9)
Prior Value compares a measured value with the previously measured value. Confidence intervals were not taken into account in determining the direction of the comparison.
Trend
This comparison measures the indicator’s values over multiple time periods.<br>The Mann-Kendall Test for Statistical Significance is used to evaluate the trend<br>over 4 to 10 periods of measure, subject to data availability and comparability.
County: Washtenaw
Community / Demographics
Value
Compared to:
County: Washtenaw Average Household Size
County: Washtenaw Average Household Size
2.40
Persons per household
(2018-2022)
Compared to:

MI Value
(2.50)
The regional value is compared to the Michigan State value.
US Value
(2.60)
The regional value is compared to the national value.
Trend
This comparison measures the indicator’s values over multiple time periods.<br>The Mann-Kendall Test for Statistical Significance is used to evaluate the trend<br>over 4 to 10 periods of measure, subject to data availability and comparability.
County: Washtenaw Female Population
County: Washtenaw Female Population
50.1%
(2022)
Compared to:

MI Value
(50.3%)
The regional value is compared to the Michigan State value.
US Value
(50.4%)
The regional value is compared to the national value.
Prior Value
(50.1%)
Prior Value compares a measured value with the previously measured value. Confidence intervals were not taken into account in determining the direction of the comparison.
Trend
This comparison measures the indicator’s values over multiple time periods.<br>The Mann-Kendall Test for Statistical Significance is used to evaluate the trend<br>over 4 to 10 periods of measure, subject to data availability and comparability.
County: Washtenaw Foreign Born Persons
County: Washtenaw Foreign Born Persons
12.4%
(2018-2022)
Compared to:

MI Value
(6.9%)
The regional value is compared to the Michigan State value.
US Value
(13.7%)
The regional value is compared to the national value.
Trend
This comparison measures the indicator’s values over multiple time periods.<br>The Mann-Kendall Test for Statistical Significance is used to evaluate the trend<br>over 4 to 10 periods of measure, subject to data availability and comparability.
County: Washtenaw Households
County: Washtenaw Households
148,704
Households
(2018-2022)
Compared to:
Trend
This comparison measures the indicator’s values over multiple time periods.<br>The Mann-Kendall Test for Statistical Significance is used to evaluate the trend<br>over 4 to 10 periods of measure, subject to data availability and comparability.
County: Washtenaw Male Population
County: Washtenaw Male Population
49.9%
(2022)
Compared to:
MI Value
(49.7%)
The regional value is compared to the Michigan State value.
US Value
(49.6%)
The regional value is compared to the national value.
Prior Value
(49.9%)
Prior Value compares a measured value with the previously measured value. Confidence intervals were not taken into account in determining the direction of the comparison.
Trend
This comparison measures the indicator’s values over multiple time periods.<br>The Mann-Kendall Test for Statistical Significance is used to evaluate the trend<br>over 4 to 10 periods of measure, subject to data availability and comparability.
County: Washtenaw Population Age 5+ with Language Other than English Spoken at Home
County: Washtenaw Population Age 5+ with Language Other than English Spoken at Home
15.1%
(2018-2022)
Compared to:
MI Value
(9.9%)
The regional value is compared to the Michigan State value.
US Value
(21.7%)
The regional value is compared to the national value.
Trend
This comparison measures the indicator’s values over multiple time periods.<br>The Mann-Kendall Test for Statistical Significance is used to evaluate the trend<br>over 4 to 10 periods of measure, subject to data availability and comparability.
County: Washtenaw Population American Indian and Alaska Native
County: Washtenaw Population American Indian and Alaska Native
0.4%
(2022)
Compared to:
MI Value
(0.7%)
The regional value is compared to the Michigan State value.
US Value
(1.3%)
The regional value is compared to the national value.
Prior Value
(0.4%)
Prior Value compares a measured value with the previously measured value. Confidence intervals were not taken into account in determining the direction of the comparison.
Trend
This comparison measures the indicator’s values over multiple time periods.<br>The Mann-Kendall Test for Statistical Significance is used to evaluate the trend<br>over 4 to 10 periods of measure, subject to data availability and comparability.
County: Washtenaw Population Asian
County: Washtenaw Population Asian
9.4%
(2022)
Compared to:


MI Value
(3.5%)
The regional value is compared to the Michigan State value.
US Value
(6.3%)
The regional value is compared to the national value.
Prior Value
(9.3%)
Prior Value compares a measured value with the previously measured value. Confidence intervals were not taken into account in determining the direction of the comparison.
Trend
This comparison measures the indicator’s values over multiple time periods.<br>The Mann-Kendall Test for Statistical Significance is used to evaluate the trend<br>over 4 to 10 periods of measure, subject to data availability and comparability.
County: Washtenaw Population Black or African American
County: Washtenaw Population Black or African American
12.4%
(2022)
Compared to:
MI Value
(14.1%)
The regional value is compared to the Michigan State value.
US Value
(13.6%)
The regional value is compared to the national value.
Prior Value
(12.5%)
Prior Value compares a measured value with the previously measured value. Confidence intervals were not taken into account in determining the direction of the comparison.
Trend
This comparison measures the indicator’s values over multiple time periods.<br>The Mann-Kendall Test for Statistical Significance is used to evaluate the trend<br>over 4 to 10 periods of measure, subject to data availability and comparability.
County: Washtenaw Population Hispanic or Latino
County: Washtenaw Population Hispanic or Latino
5.3%
(2022)
Compared to:
MI Value
(5.7%)
The regional value is compared to the Michigan State value.
US Value
(19.1%)
The regional value is compared to the national value.
Prior Value
(5.2%)
Prior Value compares a measured value with the previously measured value. Confidence intervals were not taken into account in determining the direction of the comparison.
Trend
This comparison measures the indicator’s values over multiple time periods.<br>The Mann-Kendall Test for Statistical Significance is used to evaluate the trend<br>over 4 to 10 periods of measure, subject to data availability and comparability.
County: Washtenaw Population Native Hawaiian and Other Pacific Islander
County: Washtenaw Population Native Hawaiian and Other Pacific Islander
0.1%
(2022)
Compared to:
MI Value
(0.0%)
The regional value is compared to the Michigan State value.
US Value
(0.3%)
The regional value is compared to the national value.
Prior Value
(0.1%)
Prior Value compares a measured value with the previously measured value. Confidence intervals were not taken into account in determining the direction of the comparison.
Trend
This comparison measures the indicator’s values over multiple time periods.<br>The Mann-Kendall Test for Statistical Significance is used to evaluate the trend<br>over 4 to 10 periods of measure, subject to data availability and comparability.
County: Washtenaw Population Over Age 65
County: Washtenaw Population Over Age 65
15.9%
(2022)
Compared to:
MI Value
(18.7%)
The regional value is compared to the Michigan State value.
US Value
(17.3%)
The regional value is compared to the national value.
Prior Value
(15.5%)
Prior Value compares a measured value with the previously measured value. Confidence intervals were not taken into account in determining the direction of the comparison.
Trend
This comparison measures the indicator’s values over multiple time periods.<br>The Mann-Kendall Test for Statistical Significance is used to evaluate the trend<br>over 4 to 10 periods of measure, subject to data availability and comparability.
County: Washtenaw Population Over Age 65 (Count)
County: Washtenaw Population Over Age 65 (Count)
54,677
People
(2018-2022)
Compared to:
Trend
This comparison measures the indicator’s values over multiple time periods.<br>The Mann-Kendall Test for Statistical Significance is used to evaluate the trend<br>over 4 to 10 periods of measure, subject to data availability and comparability.
County: Washtenaw Population Two or More Races
County: Washtenaw Population Two or More Races
3.8%
(2022)
Compared to:
MI Value
(2.8%)
The regional value is compared to the Michigan State value.
US Value
(3.0%)
The regional value is compared to the national value.
Prior Value
(3.8%)
Prior Value compares a measured value with the previously measured value. Confidence intervals were not taken into account in determining the direction of the comparison.
Trend
This comparison measures the indicator’s values over multiple time periods.<br>The Mann-Kendall Test for Statistical Significance is used to evaluate the trend<br>over 4 to 10 periods of measure, subject to data availability and comparability.
County: Washtenaw Population Under Age 18
County: Washtenaw Population Under Age 18
18.0%
(2022)
Compared to:
MI Value
(21.0%)
The regional value is compared to the Michigan State value.
US Value
(21.7%)
The regional value is compared to the national value.
Prior Value
(18.2%)
Prior Value compares a measured value with the previously measured value. Confidence intervals were not taken into account in determining the direction of the comparison.
Trend
This comparison measures the indicator’s values over multiple time periods.<br>The Mann-Kendall Test for Statistical Significance is used to evaluate the trend<br>over 4 to 10 periods of measure, subject to data availability and comparability.
County: Washtenaw Population Under Age 5
County: Washtenaw Population Under Age 5
4.5%
(2022)
Compared to:
MI Value
(5.3%)
The regional value is compared to the Michigan State value.
US Value
(5.6%)
The regional value is compared to the national value.
Prior Value
(4.6%)
Prior Value compares a measured value with the previously measured value. Confidence intervals were not taken into account in determining the direction of the comparison.
Trend
This comparison measures the indicator’s values over multiple time periods.<br>The Mann-Kendall Test for Statistical Significance is used to evaluate the trend<br>over 4 to 10 periods of measure, subject to data availability and comparability.
County: Washtenaw Population White
County: Washtenaw Population White
73.9%
(2022)
Compared to:
MI Value
(78.8%)
The regional value is compared to the Michigan State value.
US Value
(75.5%)
The regional value is compared to the national value.
Prior Value
(74.0%)
Prior Value compares a measured value with the previously measured value. Confidence intervals were not taken into account in determining the direction of the comparison.
Trend
This comparison measures the indicator’s values over multiple time periods.<br>The Mann-Kendall Test for Statistical Significance is used to evaluate the trend<br>over 4 to 10 periods of measure, subject to data availability and comparability.
County: Washtenaw Population White (Not Hispanic or Latino)
County: Washtenaw Population White (Not Hispanic or Latino)
69.5%
(2022)
Compared to:
MI Value
(74.0%)
The regional value is compared to the Michigan State value.
US Value
(58.9%)
The regional value is compared to the national value.
Prior Value
(69.7%)
Prior Value compares a measured value with the previously measured value. Confidence intervals were not taken into account in determining the direction of the comparison.
Trend
This comparison measures the indicator’s values over multiple time periods.<br>The Mann-Kendall Test for Statistical Significance is used to evaluate the trend<br>over 4 to 10 periods of measure, subject to data availability and comparability.
County: Washtenaw Total Population
County: Washtenaw Total Population
365,536
People
(2023)
Compared to:
Prior Value
(366,504)
Prior Value compares a measured value with the previously measured value. Confidence intervals were not taken into account in determining the direction of the comparison.
Trend
This comparison measures the indicator’s values over multiple time periods.<br>The Mann-Kendall Test for Statistical Significance is used to evaluate the trend<br>over 4 to 10 periods of measure, subject to data availability and comparability.
County: Washtenaw Veteran Population
County: Washtenaw Veteran Population
4.3%
(2018-2022)
Compared to:
MI Value
(6.3%)
The regional value is compared to the Michigan State value.
US Value
(6.6%)
The regional value is compared to the national value.
Trend
This comparison measures the indicator’s values over multiple time periods.<br>The Mann-Kendall Test for Statistical Significance is used to evaluate the trend<br>over 4 to 10 periods of measure, subject to data availability and comparability.
County: Washtenaw
Community / Public Safety
Value
Compared to:
County: Washtenaw Alcohol-Impaired Driving Deaths
County: Washtenaw Alcohol-Impaired Driving Deaths
34.5%
Percent of driving deaths with alcohol involvement
(2017-2021)
Compared to:
MI Counties
The distribution is based on data from 83 Michigan counties.
U.S. Counties
The distribution is based on data from 3,116 U.S. counties and county equivalents.
MI Value
(30.2%)
The regional value is compared to the Michigan State value.
US Value
(26.3%)
The regional value is compared to the national value.
Prior Value
(30.6%)
Prior Value compares a measured value with the previously measured value. Confidence intervals were taken into account in determining the direction of the comparison.
Trend
This comparison measures the indicator’s values over multiple time periods.<br>The Mann-Kendall Test for Statistical Significance is used to evaluate the trend<br>over 4 to 10 periods of measure, subject to data availability and comparability.
County: Washtenaw Deaths due to Transport Fatal Injuries
County: Washtenaw Deaths due to Transport Fatal Injuries
23
Deaths
(2022)
Compared to:
Prior Value
(33)
Prior Value compares a measured value with the previously measured value. Confidence intervals were not taken into account in determining the direction of the comparison.
Trend
This comparison measures the indicator’s values over multiple time periods.<br>The Mann-Kendall Test for Statistical Significance is used to evaluate the trend<br>over 4 to 10 periods of measure, subject to data availability and comparability.
County: Washtenaw
Community / Social Environment
Value
Compared to:
County: Washtenaw Children in Single-Parent Households
County: Washtenaw Children in Single-Parent Households
21.7%
(2018-2022)
Compared to:
MI Counties
The distribution is based on data from 83 Michigan counties.
U.S. Counties
The distribution is based on data from 3,132 U.S. counties and county equivalents.
MI Value
(25.2%)
The regional value is compared to the Michigan State value.
US Value
(24.9%)
The regional value is compared to the national value.
Trend
This comparison measures the indicator’s values over multiple time periods.<br>The Mann-Kendall Test for Statistical Significance is used to evaluate the trend<br>over 4 to 10 periods of measure, subject to data availability and comparability.
County: Washtenaw People 65+ Living Alone
County: Washtenaw People 65+ Living Alone
26.4%
(2018-2022)
Compared to:
MI Counties
The distribution is based on data from 83 Michigan counties.
U.S. Counties
The distribution is based on data from 3,133 U.S. counties and county equivalents.
MI Value
(28.4%)
The regional value is compared to the Michigan State value.
US Value
(26.4%)
The regional value is compared to the national value.
Trend
This comparison measures the indicator’s values over multiple time periods.<br>The Mann-Kendall Test for Statistical Significance is used to evaluate the trend<br>over 4 to 10 periods of measure, subject to data availability and comparability.
County: Washtenaw People 65+ Living Alone (Count)
County: Washtenaw People 65+ Living Alone (Count)
14,461
People
(2018-2022)
Compared to:
Trend
This comparison measures the indicator’s values over multiple time periods.<br>The Mann-Kendall Test for Statistical Significance is used to evaluate the trend<br>over 4 to 10 periods of measure, subject to data availability and comparability.
County: Washtenaw Social Associations
County: Washtenaw Social Associations
9.9
Membership associations per 10,000 population
(2021)
Compared to:

MI Counties
The distribution is based on data from 83 Michigan counties.
U.S. Counties
The distribution is based on data from 3,141 U.S. counties and county equivalents.
MI Value
(9.5)
The regional value is compared to the Michigan State value.
US Value
(9.1)
The regional value is compared to the national value.
Prior Value
(10.3)
Prior Value compares a measured value with the previously measured value. Confidence intervals were not taken into account in determining the direction of the comparison.
Trend
This comparison measures the indicator’s values over multiple time periods.<br>The Mann-Kendall Test for Statistical Significance is used to evaluate the trend<br>over 4 to 10 periods of measure, subject to data availability and comparability.
County: Washtenaw Substantiated Child Abuse Rate
County: Washtenaw Substantiated Child Abuse Rate
8.3
Cases per 1,000 children
(2022)
Compared to:
MI Counties
The distribution is based on data from 82 Michigan counties.
MI Value
(11.7)
The regional value is compared to the Michigan State value.
Prior Value
(7.5)
Prior Value compares a measured value with the previously measured value. Confidence intervals were not taken into account in determining the direction of the comparison.
Trend
This comparison measures the indicator’s values over multiple time periods.<br>The Mann-Kendall Test for Statistical Significance is used to evaluate the trend<br>over 4 to 10 periods of measure, subject to data availability and comparability.
HP 2030 Target
(8.7)
51.4%
(2022)
Compared to:
Prior Value
(57.0%)
Prior Value compares a measured value with the previously measured value. Confidence intervals were not taken into account in determining the direction of the comparison.
Trend
This comparison measures the indicator’s values over multiple time periods.<br>The Mann-Kendall Test for Statistical Significance is used to evaluate the trend<br>over 4 to 10 periods of measure, subject to data availability and comparability.
61.3%
(2022)
Compared to:

Prior Value
(65.9%)
Prior Value compares a measured value with the previously measured value. Confidence intervals were not taken into account in determining the direction of the comparison.
Trend
This comparison measures the indicator’s values over multiple time periods.<br>The Mann-Kendall Test for Statistical Significance is used to evaluate the trend<br>over 4 to 10 periods of measure, subject to data availability and comparability.
51.8%
(2022)
Compared to:
Prior Value
(53.1%)
Prior Value compares a measured value with the previously measured value. Confidence intervals were not taken into account in determining the direction of the comparison.
Trend
This comparison measures the indicator’s values over multiple time periods.<br>The Mann-Kendall Test for Statistical Significance is used to evaluate the trend<br>over 4 to 10 periods of measure, subject to data availability and comparability.
County: Washtenaw
Community / Transportation
Value
Compared to:
County: Washtenaw Households without a Vehicle
County: Washtenaw Households without a Vehicle
8.1%
(2018-2022)
Compared to:
MI Counties
The distribution is based on data from 83 Michigan counties.
U.S. Counties
The distribution is based on data from 3,133 U.S. counties and county equivalents.
MI Value
(7.2%)
The regional value is compared to the Michigan State value.
US Value
(8.3%)
The regional value is compared to the national value.
Trend
This comparison measures the indicator’s values over multiple time periods.<br>The Mann-Kendall Test for Statistical Significance is used to evaluate the trend<br>over 4 to 10 periods of measure, subject to data availability and comparability.
County: Washtenaw Mean Travel Time to Work
County: Washtenaw Mean Travel Time to Work
23.6
Minutes
(2018-2022)
Compared to:
MI Counties
The distribution is based on data from 83 Michigan counties.
U.S. Counties
The distribution is based on data from 3,131 U.S. counties and county equivalents.
MI Value
(24.5)
The regional value is compared to the Michigan State value.
US Value
(26.7)
The regional value is compared to the national value.
Trend
This comparison measures the indicator’s values over multiple time periods.<br>The Mann-Kendall Test for Statistical Significance is used to evaluate the trend<br>over 4 to 10 periods of measure, subject to data availability and comparability.
County: Washtenaw Solo Drivers with a Long Commute
County: Washtenaw Solo Drivers with a Long Commute
31.9%
(2018-2022)
Compared to:
MI Counties
The distribution is based on data from 83 Michigan counties.
U.S. Counties
The distribution is based on data from 3,141 U.S. counties and county equivalents.
MI Value
(33.4%)
The regional value is compared to the Michigan State value.
US Value
(36.4%)
The regional value is compared to the national value.
Prior Value
(32.6%)
Prior Value compares a measured value with the previously measured value. Confidence intervals were taken into account in determining the direction of the comparison.
Trend
This comparison measures the indicator’s values over multiple time periods.<br>The Mann-Kendall Test for Statistical Significance is used to evaluate the trend<br>over 4 to 10 periods of measure, subject to data availability and comparability.
County: Washtenaw Workers Commuting by Public Transportation
County: Washtenaw Workers Commuting by Public Transportation
3.9%
(2018-2022)
Compared to:
MI Counties
The distribution is based on data from 83 Michigan counties.
U.S. Counties
(2015-2019)
The distribution is based on data from 3,142 U.S. counties and county equivalents.
MI Value
(1.1%)
The regional value is compared to the Michigan State value.
US Value
(3.8%)
The regional value is compared to the national value.
Trend
This comparison measures the indicator’s values over multiple time periods.<br>The Mann-Kendall Test for Statistical Significance is used to evaluate the trend<br>over 4 to 10 periods of measure, subject to data availability and comparability.
HP 2030 Target
(5.3%)
County: Washtenaw Workers who Drive Alone to Work
County: Washtenaw Workers who Drive Alone to Work
63.4%
(2018-2022)
Compared to:
MI Counties
The distribution is based on data from 83 Michigan counties.
U.S. Counties
The distribution is based on data from 3,133 U.S. counties and county equivalents.
MI Value
(77.1%)
The regional value is compared to the Michigan State value.
US Value
(71.7%)
The regional value is compared to the national value.
Trend
This comparison measures the indicator’s values over multiple time periods.<br>The Mann-Kendall Test for Statistical Significance is used to evaluate the trend<br>over 4 to 10 periods of measure, subject to data availability and comparability.
County: Washtenaw
Economy / Employment
Value
Compared to:
County: Washtenaw Employer Establishments
County: Washtenaw Employer Establishments
8,150
Number of Establishments
(2021)
Compared to:
Prior Value
(8,222)
Prior Value compares a measured value with the previously measured value. Confidence intervals were not taken into account in determining the direction of the comparison.
Trend
This comparison measures the indicator’s values over multiple time periods.<br>The Mann-Kendall Test for Statistical Significance is used to evaluate the trend<br>over 4 to 10 periods of measure, subject to data availability and comparability.
County: Washtenaw Female Population 16+ in Civilian Labor Force
County: Washtenaw Female Population 16+ in Civilian Labor Force
60.0%
(2018-2022)
Compared to:
MI Counties
The distribution is based on data from 83 Michigan counties.
U.S. Counties
The distribution is based on data from 3,133 U.S. counties and county equivalents.
MI Value
(57.1%)
The regional value is compared to the Michigan State value.
US Value
(58.5%)
The regional value is compared to the national value.
Trend
This comparison measures the indicator’s values over multiple time periods.<br>The Mann-Kendall Test for Statistical Significance is used to evaluate the trend<br>over 4 to 10 periods of measure, subject to data availability and comparability.
County: Washtenaw Population 16+ in Civilian Labor Force
County: Washtenaw Population 16+ in Civilian Labor Force
60.7%
(2018-2022)
Compared to:
MI Counties
The distribution is based on data from 83 Michigan counties.
U.S. Counties
The distribution is based on data from 3,133 U.S. counties and county equivalents.
MI Value
(57.7%)
The regional value is compared to the Michigan State value.
US Value
(59.6%)
The regional value is compared to the national value.
Trend
This comparison measures the indicator’s values over multiple time periods.<br>The Mann-Kendall Test for Statistical Significance is used to evaluate the trend<br>over 4 to 10 periods of measure, subject to data availability and comparability.
County: Washtenaw Size of Labor Force
County: Washtenaw Size of Labor Force
201,121
Persons
(January 2024)
Compared to:
Prior Value
(201,504)
Prior Value compares a measured value with the previously measured value. Confidence intervals were not taken into account in determining the direction of the comparison.
Trend
This comparison measures the indicator’s values over multiple time periods.<br>The Mann-Kendall Test for Statistical Significance is used to evaluate the trend<br>over 4 to 10 periods of measure, subject to data availability and comparability.
County: Washtenaw Total Employment
County: Washtenaw Total Employment
145,041
Paid Employees
(2021)
Compared to:
Prior Value
(156,611)
Prior Value compares a measured value with the previously measured value. Confidence intervals were not taken into account in determining the direction of the comparison.
Trend
This comparison measures the indicator’s values over multiple time periods.<br>The Mann-Kendall Test for Statistical Significance is used to evaluate the trend<br>over 4 to 10 periods of measure, subject to data availability and comparability.
County: Washtenaw Total Employment Change
County: Washtenaw Total Employment Change
-7.4%
(2020-2021)
Compared to:
MI Counties
The distribution is based on data from 83 Michigan counties.
U.S. Counties
The distribution is based on data from 3,140 U.S. counties and county equivalents.
MI Value
(-5.8%)
The regional value is compared to the Michigan State value.
US Value
(-4.3%)
The regional value is compared to the national value.
Prior Value
(-1.6%)
Prior Value compares a measured value with the previously measured value. Confidence intervals were not taken into account in determining the direction of the comparison.
Trend
This comparison measures the indicator’s values over multiple time periods.<br>The Mann-Kendall Test for Statistical Significance is used to evaluate the trend<br>over 4 to 10 periods of measure, subject to data availability and comparability.
County: Washtenaw Unemployed Workers in Civilian Labor Force
County: Washtenaw Unemployed Workers in Civilian Labor Force
2.9%
(January 2024)
Compared to:
MI Counties
The distribution is based on data from 83 Michigan counties.
U.S. Counties
The distribution is based on non-seasonally-adjusted data from 3,140 U.S. counties and county equivalents.
MI Value
(4.0%)
The regional value is compared to the Michigan State value.
US Value
(4.1%)
The regional value is compared to the national value.
Prior Value
(2.7%)
Prior Value compares a measured value with the previously measured value. Confidence intervals were not taken into account in determining the direction of the comparison.
Trend
This comparison measures the indicator’s values over multiple time periods.<br>The Mann-Kendall Test for Statistical Significance is used to evaluate the trend<br>over 4 to 10 periods of measure, subject to data availability and comparability.
County: Washtenaw
Economy / Food Insecurity
Value
Compared to:
County: Washtenaw Adults in Family Reduced Food Intake Due to Cost
County: Washtenaw Adults in Family Reduced Food Intake Due to Cost
7.2%
% of adults in family
(2015)
Compared to:
Prior Value
(5.3%)
Prior Value compares a measured value with the previously measured value. Confidence intervals were not taken into account in determining the direction of the comparison.
County: Washtenaw Child Food Insecurity Rate
County: Washtenaw Child Food Insecurity Rate
6.8%
(2021)
Compared to:
MI Counties
The distribution is based on data from 83 Michigan counties.
U.S. Counties
The distribution is based on data from 3,140 U.S. counties and county equivalents.
MI Value
(13.1%)
The regional value is compared to the Michigan State value.
US Value
(12.8%)
The regional value is compared to the national value.
Prior Value
(8.8%)
Prior Value compares a measured value with the previously measured value. Confidence intervals were not taken into account in determining the direction of the comparison.
Trend
This comparison measures the indicator’s values over multiple time periods.<br>The Mann-Kendall Test for Statistical Significance is used to evaluate the trend<br>over 4 to 10 periods of measure, subject to data availability and comparability.
County: Washtenaw Food Insecurity Rate
County: Washtenaw Food Insecurity Rate
9.6%
(2021)
Compared to:
MI Counties
The distribution is based on data from 83 Michigan counties.
U.S. Counties
The distribution is based on data from 3,140 U.S. counties and county equivalents.
MI Value
(11.7%)
The regional value is compared to the Michigan State value.
US Value
(10.4%)
The regional value is compared to the national value.
Prior Value
(10.4%)
Prior Value compares a measured value with the previously measured value. Confidence intervals were not taken into account in determining the direction of the comparison.
Trend
This comparison measures the indicator’s values over multiple time periods.<br>The Mann-Kendall Test for Statistical Significance is used to evaluate the trend<br>over 4 to 10 periods of measure, subject to data availability and comparability.
County: Washtenaw Households Receiving SNAP with Children
County: Washtenaw Households Receiving SNAP with Children
42.2%
(2018-2022)
Compared to:
MI Value
(43.0%)
The regional value is compared to the Michigan State value.
US Value
(47.9%)
The regional value is compared to the national value.
Trend
This comparison measures the indicator’s values over multiple time periods.<br>The Mann-Kendall Test for Statistical Significance is used to evaluate the trend<br>over 4 to 10 periods of measure, subject to data availability and comparability.
County: Washtenaw Households Receiving SNAP with Children (Count)
County: Washtenaw Households Receiving SNAP with Children (Count)
4,540
Households
(2018-2022)
Compared to:
Trend
This comparison measures the indicator’s values over multiple time periods.<br>The Mann-Kendall Test for Statistical Significance is used to evaluate the trend<br>over 4 to 10 periods of measure, subject to data availability and comparability.
County: Washtenaw Projected Child Food Insecurity Rate
County: Washtenaw Projected Child Food Insecurity Rate
8.8%
(2021)
Compared to:
MI Counties
The distribution is based on data from 83 Michigan counties.
U.S. Counties
The distribution is based on data from 3,142 U.S. counties and county equivalents.
MI Value
(16.0%)
The regional value is compared to the Michigan State value.
Prior Value
(15.5%)
Prior Value compares a measured value with the previously measured value. Confidence intervals were not taken into account in determining the direction of the comparison.
County: Washtenaw Projected Food Insecurity Rate
County: Washtenaw Projected Food Insecurity Rate
11.6%
(2021)
Compared to:
MI Counties
The distribution is based on data from 83 Michigan counties.
U.S. Counties
The distribution is based on data from 3,142 U.S. counties and county equivalents.
MI Value
(14.2%)
The regional value is compared to the Michigan State value.
Prior Value
(15.2%)
Prior Value compares a measured value with the previously measured value. Confidence intervals were not taken into account in determining the direction of the comparison.
County: Washtenaw Students Eligible for the Free Lunch Program
County: Washtenaw Students Eligible for the Free Lunch Program
31.6%
(2022-2023)
Compared to:
MI Counties
The distribution is based on data from 83 Michigan counties.
U.S. Counties
The distribution is based on data from 2,710 U.S. counties and county equivalents.
MI Value
(49.2%)
The regional value is compared to the Michigan State value.
US Value
(42.8%)
The regional value is compared to the national value.
Prior Value
(29.6%)
Prior Value compares a measured value with the previously measured value. Confidence intervals were not taken into account in determining the direction of the comparison.
Trend
This comparison measures the indicator’s values over multiple time periods.<br>The Mann-Kendall Test for Statistical Significance is used to evaluate the trend<br>over 4 to 10 periods of measure, subject to data availability and comparability.
County: Washtenaw
Economy / Government Assistance
Value
Compared to:
County: Washtenaw Households with Cash Public Assistance Income
County: Washtenaw Households with Cash Public Assistance Income
2.0%
(2018-2022)
Compared to:
MI Counties
The distribution is based on data from 83 Michigan counties.
U.S. Counties
The distribution is based on data from 2,923 U.S. counties and county equivalents.
MI Value
(2.8%)
The regional value is compared to the Michigan State value.
US Value
(2.7%)
The regional value is compared to the national value.
Trend
This comparison measures the indicator’s values over multiple time periods.<br>The Mann-Kendall Test for Statistical Significance is used to evaluate the trend<br>over 4 to 10 periods of measure, subject to data availability and comparability.
County: Washtenaw SNAP Benefits Per Capita
County: Washtenaw SNAP Benefits Per Capita
$10.1
(2017)
Compared to:
Prior Value
($15.2)
Prior Value compares a measured value with the previously measured value. Confidence intervals were not taken into account in determining the direction of the comparison.
County: Washtenaw
Economy / Housing & Homes
Value
Compared to:
County: Washtenaw Homeowner Vacancy Rate
County: Washtenaw Homeowner Vacancy Rate
0.6%
(2018-2022)
Compared to:
MI Counties
The distribution is based on data from 83 Michigan counties.
U.S. Counties
The distribution is based on data from 3,132 U.S. counties and county equivalents.
MI Value
(1.0%)
The regional value is compared to the Michigan State value.
US Value
(1.1%)
The regional value is compared to the national value.
Trend
This comparison measures the indicator’s values over multiple time periods.<br>The Mann-Kendall Test for Statistical Significance is used to evaluate the trend<br>over 4 to 10 periods of measure, subject to data availability and comparability.
County: Washtenaw Homeownership
County: Washtenaw Homeownership
58.0%
(2018-2022)
Compared to:
MI Counties
The distribution is based on data from 83 Michigan counties.
U.S. Counties
The distribution is based on data from 3,133 U.S. counties and county equivalents.
MI Value
(63.5%)
The regional value is compared to the Michigan State value.
US Value
(57.8%)
The regional value is compared to the national value.
Trend
This comparison measures the indicator’s values over multiple time periods.<br>The Mann-Kendall Test for Statistical Significance is used to evaluate the trend<br>over 4 to 10 periods of measure, subject to data availability and comparability.
County: Washtenaw Housing Units
County: Washtenaw Housing Units
159,296
Housing units
(2022)
Compared to:
Prior Value
(158,183)
Prior Value compares a measured value with the previously measured value. Confidence intervals were not taken into account in determining the direction of the comparison.
Trend
This comparison measures the indicator’s values over multiple time periods.<br>The Mann-Kendall Test for Statistical Significance is used to evaluate the trend<br>over 4 to 10 periods of measure, subject to data availability and comparability.
County: Washtenaw Median Household Gross Rent
County: Washtenaw Median Household Gross Rent
$1,335
(2018-2022)
Compared to:
MI Counties
The distribution is based on data from 83 Michigan counties.
MI Value
($1,037)
The regional value is compared to the Michigan State value.
US Value
($1,268)
The regional value is compared to the national value.
Trend
This comparison measures the indicator’s values over multiple time periods.<br>The Mann-Kendall Test for Statistical Significance is used to evaluate the trend<br>over 4 to 10 periods of measure, subject to data availability and comparability.
County: Washtenaw Median Housing Unit Value
County: Washtenaw Median Housing Unit Value
$336,300
(2018-2022)
Compared to:
MI Counties
The distribution is based on data from 83 Michigan counties.
MI Value
($201,100)
The regional value is compared to the Michigan State value.
US Value
($281,900)
The regional value is compared to the national value.
Trend
This comparison measures the indicator’s values over multiple time periods.<br>The Mann-Kendall Test for Statistical Significance is used to evaluate the trend<br>over 4 to 10 periods of measure, subject to data availability and comparability.
County: Washtenaw Median Monthly Owner Costs for Households without a Mortgage
County: Washtenaw Median Monthly Owner Costs for Households without a Mortgage
$832
(2018-2022)
Compared to:
MI Counties
The distribution is based on data from 83 Michigan counties.
MI Value
($565)
The regional value is compared to the Michigan State value.
US Value
($584)
The regional value is compared to the national value.
Trend
This comparison measures the indicator’s values over multiple time periods.<br>The Mann-Kendall Test for Statistical Significance is used to evaluate the trend<br>over 4 to 10 periods of measure, subject to data availability and comparability.
County: Washtenaw Mortgaged Owners Median Monthly Household Costs
County: Washtenaw Mortgaged Owners Median Monthly Household Costs
$2,015
(2018-2022)
Compared to:
MI Counties
The distribution is based on data from 83 Michigan counties.
MI Value
($1,472)
The regional value is compared to the Michigan State value.
US Value
($1,828)
The regional value is compared to the national value.
Trend
This comparison measures the indicator’s values over multiple time periods.<br>The Mann-Kendall Test for Statistical Significance is used to evaluate the trend<br>over 4 to 10 periods of measure, subject to data availability and comparability.
County: Washtenaw Mortgaged Owners Spending 30% or More of Household Income on Housing
County: Washtenaw Mortgaged Owners Spending 30% or More of Household Income on Housing
26.1%
(2022)
Compared to:
U.S. Counties
The distribution is based on data from 828 U.S. counties and county equivalents.
MI Value
(23.9%)
The regional value is compared to the Michigan State value.
US Value
(27.8%)
The regional value is compared to the national value.
Prior Value
(22.3%)
Prior Value compares a measured value with the previously measured value. Confidence intervals were not taken into account in determining the direction of the comparison.
Trend
This comparison measures the indicator’s values over multiple time periods.<br>The Mann-Kendall Test for Statistical Significance is used to evaluate the trend<br>over 4 to 10 periods of measure, subject to data availability and comparability.
HP 2030 Target
(25.5%)
County: Washtenaw Overcrowded Households
County: Washtenaw Overcrowded Households
1.4%
(2018-2022)
Compared to:
MI Counties
The distribution is based on data from 83 Michigan counties.
MI Value
(1.6%)
The regional value is compared to the Michigan State value.
US Value
(3.4%)
The regional value is compared to the national value.
Trend
This comparison measures the indicator’s values over multiple time periods.<br>The Mann-Kendall Test for Statistical Significance is used to evaluate the trend<br>over 4 to 10 periods of measure, subject to data availability and comparability.
County: Washtenaw Renters Spending 30% or More of Household Income on Rent
County: Washtenaw Renters Spending 30% or More of Household Income on Rent
53.0%
(2018-2022)
Compared to:
MI Counties
The distribution is based on data from 83 Michigan counties.
U.S. Counties
The distribution is based on data from 3,132 U.S. counties and county equivalents.
MI Value
(49.0%)
The regional value is compared to the Michigan State value.
US Value
(49.9%)
The regional value is compared to the national value.
Trend
This comparison measures the indicator’s values over multiple time periods.<br>The Mann-Kendall Test for Statistical Significance is used to evaluate the trend<br>over 4 to 10 periods of measure, subject to data availability and comparability.
HP 2030 Target
(25.5%)
County: Washtenaw Severe Housing Problems
County: Washtenaw Severe Housing Problems
16.5%
(2016-2020)
Compared to:
MI Counties
The distribution is based on data from 83 Michigan counties.
U.S. Counties
The distribution is based on data from 3,141 U.S. counties and county equivalents.
MI Value
(13.4%)
The regional value is compared to the Michigan State value.
US Value
(16.7%)
The regional value is compared to the national value.
Prior Value
(16.3%)
Prior Value compares a measured value with the previously measured value. Confidence intervals were taken into account in determining the direction of the comparison.
Trend
This comparison measures the indicator’s values over multiple time periods.<br>The Mann-Kendall Test for Statistical Significance is used to evaluate the trend<br>over 4 to 10 periods of measure, subject to data availability and comparability.
County: Washtenaw
Economy / Income
Value
Compared to:
60.4%
(2021)
Compared to:
MI Counties
The distribution is based on data from 83 Michigan counties.
MI Value
(61.0%)
The regional value is compared to the Michigan State value.
Prior Value
(69.2%)
Prior Value compares a measured value with the previously measured value. Confidence intervals were not taken into account in determining the direction of the comparison.
Trend
This comparison measures the indicator’s values over multiple time periods.<br>The Mann-Kendall Test for Statistical Significance is used to evaluate the trend<br>over 4 to 10 periods of measure, subject to data availability and comparability.
County: Washtenaw Households that are Asset Limited, Income Constrained, Employed (ALICE)
County: Washtenaw Households that are Asset Limited, Income Constrained, Employed (ALICE)
26.6%
(2021)
Compared to:
MI Counties
The distribution is based on data from 83 Michigan counties.
MI Value
(26.0%)
The regional value is compared to the Michigan State value.
Prior Value
(18.8%)
Prior Value compares a measured value with the previously measured value. Confidence intervals were not taken into account in determining the direction of the comparison.
Trend
This comparison measures the indicator’s values over multiple time periods.<br>The Mann-Kendall Test for Statistical Significance is used to evaluate the trend<br>over 4 to 10 periods of measure, subject to data availability and comparability.
County: Washtenaw Income Inequality
County: Washtenaw Income Inequality
0.489
(2018-2022)
Compared to:
MI Counties
The distribution is based on data from 83 Michigan counties.
U.S. Counties
The distribution is based on data from 3,133 U.S. counties and county equivalents.
MI Value
(0.464)
The regional value is compared to the Michigan State value.
US Value
(0.483)
The regional value is compared to the national value.
Trend
This comparison measures the indicator’s values over multiple time periods.<br>The Mann-Kendall Test for Statistical Significance is used to evaluate the trend<br>over 4 to 10 periods of measure, subject to data availability and comparability.
County: Washtenaw Median Household Income
County: Washtenaw Median Household Income
$84,245
(2018-2022)
Compared to:
MI Counties
The distribution is based on data from 83 Michigan counties.
U.S. Counties
The distribution is based on data from 3,132 U.S. counties and county equivalents.
MI Value
($68,505)
The regional value is compared to the Michigan State value.
US Value
($75,149)
The regional value is compared to the national value.
Trend
This comparison measures the indicator’s values over multiple time periods.<br>The Mann-Kendall Test for Statistical Significance is used to evaluate the trend<br>over 4 to 10 periods of measure, subject to data availability and comparability.
County: Washtenaw Per Capita Income
County: Washtenaw Per Capita Income
$49,568
(2018-2022)
Compared to:
MI Counties
The distribution is based on data from 83 Michigan counties.
U.S. Counties
The distribution is based on data from 3,133 U.S. counties and county equivalents.
MI Value
($37,929)
The regional value is compared to the Michigan State value.
US Value
($41,261)
The regional value is compared to the national value.
Trend
This comparison measures the indicator’s values over multiple time periods.<br>The Mann-Kendall Test for Statistical Significance is used to evaluate the trend<br>over 4 to 10 periods of measure, subject to data availability and comparability.
County: Washtenaw
Economy / Poverty
Value
Compared to:
County: Washtenaw Children Living Below Poverty Level
County: Washtenaw Children Living Below Poverty Level
11.4%
(2018-2022)
Compared to:
MI Counties
The distribution is based on data from 83 Michigan counties.
U.S. Counties
The distribution is based on data from 3,132 U.S. counties and county equivalents.
MI Value
(17.8%)
The regional value is compared to the Michigan State value.
US Value
(16.7%)
The regional value is compared to the national value.
Trend
This comparison measures the indicator’s values over multiple time periods.<br>The Mann-Kendall Test for Statistical Significance is used to evaluate the trend<br>over 4 to 10 periods of measure, subject to data availability and comparability.
County: Washtenaw Families Living Below Poverty Level
County: Washtenaw Families Living Below Poverty Level
6.2%
(2018-2022)
Compared to:
MI Counties
The distribution is based on data from 83 Michigan counties.
U.S. Counties
The distribution is based on data from 3,104 U.S. counties and county equivalents.
MI Value
(8.8%)
The regional value is compared to the Michigan State value.
US Value
(8.8%)
The regional value is compared to the national value.
Trend
This comparison measures the indicator’s values over multiple time periods.<br>The Mann-Kendall Test for Statistical Significance is used to evaluate the trend<br>over 4 to 10 periods of measure, subject to data availability and comparability.
County: Washtenaw Households Living Below Poverty Level
County: Washtenaw Households Living Below Poverty Level
13.0%
(2021)
Compared to:
MI Counties
The distribution is based on data from 83 Michigan counties.
MI Value
(13.0%)
The regional value is compared to the Michigan State value.
Prior Value
(12.0%)
Prior Value compares a measured value with the previously measured value. Confidence intervals were not taken into account in determining the direction of the comparison.
Trend
This comparison measures the indicator’s values over multiple time periods.<br>The Mann-Kendall Test for Statistical Significance is used to evaluate the trend<br>over 4 to 10 periods of measure, subject to data availability and comparability.
County: Washtenaw Households with Children
County: Washtenaw Households with Children
36,610
Households
(2022)
Compared to:
Prior Value
(36,961)
Prior Value compares a measured value with the previously measured value. Confidence intervals were taken into account in determining the direction of the comparison.
County: Washtenaw People 65+ Living Below Poverty Level
County: Washtenaw People 65+ Living Below Poverty Level
6.2%
(2018-2022)
Compared to:
MI Counties
The distribution is based on data from 83 Michigan counties.
U.S. Counties
The distribution is based on data from 3,133 U.S. counties and county equivalents.
MI Value
(9.0%)
The regional value is compared to the Michigan State value.
US Value
(10.0%)
The regional value is compared to the national value.
Trend
This comparison measures the indicator’s values over multiple time periods.<br>The Mann-Kendall Test for Statistical Significance is used to evaluate the trend<br>over 4 to 10 periods of measure, subject to data availability and comparability.
County: Washtenaw People 65+ Living Below Poverty Level (Count)
County: Washtenaw People 65+ Living Below Poverty Level (Count)
3,305
People
(2018-2022)
Compared to:
Trend
This comparison measures the indicator’s values over multiple time periods.<br>The Mann-Kendall Test for Statistical Significance is used to evaluate the trend<br>over 4 to 10 periods of measure, subject to data availability and comparability.
County: Washtenaw People Living 200% Above Poverty Level
County: Washtenaw People Living 200% Above Poverty Level
74.3%
(2018-2022)
Compared to:
MI Counties
The distribution is based on data from 83 Michigan counties.
U.S. Counties
The distribution is based on data from 3,133 U.S. counties and county equivalents.
MI Value
(70.5%)
The regional value is compared to the Michigan State value.
US Value
(71.2%)
The regional value is compared to the national value.
Trend
This comparison measures the indicator’s values over multiple time periods.<br>The Mann-Kendall Test for Statistical Significance is used to evaluate the trend<br>over 4 to 10 periods of measure, subject to data availability and comparability.
County: Washtenaw People Living Below Poverty Level
County: Washtenaw People Living Below Poverty Level
13.8%
(2018-2022)
Compared to:
MI Counties
The distribution is based on data from 83 Michigan counties.
U.S. Counties
The distribution is based on data from 3,133 U.S. counties and county equivalents.
MI Value
(13.1%)
The regional value is compared to the Michigan State value.
US Value
(12.5%)
The regional value is compared to the national value.
Trend
This comparison measures the indicator’s values over multiple time periods.<br>The Mann-Kendall Test for Statistical Significance is used to evaluate the trend<br>over 4 to 10 periods of measure, subject to data availability and comparability.
HP 2030 Target
(8.0%)
County: Washtenaw Young Children Living Below Poverty Level
County: Washtenaw Young Children Living Below Poverty Level
11.8%
(2018-2022)
Compared to:
MI Counties
The distribution is based on data from 83 Michigan counties.
U.S. Counties
The distribution is based on data from 3,131 U.S. counties and county equivalents.
MI Value
(20.1%)
The regional value is compared to the Michigan State value.
US Value
(18.1%)
The regional value is compared to the national value.
Trend
This comparison measures the indicator’s values over multiple time periods.<br>The Mann-Kendall Test for Statistical Significance is used to evaluate the trend<br>over 4 to 10 periods of measure, subject to data availability and comparability.
County: Washtenaw Youth not in School or Working
County: Washtenaw Youth not in School or Working
1.2%
(2018-2022)
Compared to:
MI Counties
The distribution is based on data from 83 Michigan counties.
U.S. Counties
The distribution is based on data from 3,130 U.S. counties and county equivalents.
MI Value
(2.0%)
The regional value is compared to the Michigan State value.
US Value
(1.8%)
The regional value is compared to the national value.
Trend
This comparison measures the indicator’s values over multiple time periods.<br>The Mann-Kendall Test for Statistical Significance is used to evaluate the trend<br>over 4 to 10 periods of measure, subject to data availability and comparability.
County: Washtenaw
Education / Childcare & Early Childhood Education
Value
Compared to:
County: Washtenaw Child Care Centers
County: Washtenaw Child Care Centers
10.2
Per 1,000 population under age 5
(2022)
Compared to:
MI Counties
The distribution is based on data from 82 Michigan counties.
MI Value
(8.9)
The regional value is compared to the Michigan State value.
US Value
(7.0)
The regional value is compared to the national value.
Prior Value
(10.5)
Prior Value compares a measured value with the previously measured value. Confidence intervals were not taken into account in determining the direction of the comparison.
County: Washtenaw
Education / Educational Attainment
Value
Compared to:
County: Washtenaw People 25+ with a Bachelor's Degree or Higher
County: Washtenaw People 25+ with a Bachelor's Degree or Higher
57.4%
(2018-2022)
Compared to:
MI Counties
The distribution is based on data from 83 Michigan counties.
U.S. Counties
The distribution is based on data from 3,133 U.S. counties and county equivalents.
MI Value
(31.1%)
The regional value is compared to the Michigan State value.
US Value
(34.3%)
The regional value is compared to the national value.
Trend
This comparison measures the indicator’s values over multiple time periods.<br>The Mann-Kendall Test for Statistical Significance is used to evaluate the trend<br>over 4 to 10 periods of measure, subject to data availability and comparability.
County: Washtenaw People 25+ with a High School Diploma or Higher
County: Washtenaw People 25+ with a High School Diploma or Higher
95.8%
(2018-2022)
Compared to:
MI Counties
The distribution is based on data from 83 Michigan counties.
U.S. Counties
The distribution is based on data from 3,133 U.S. counties and county equivalents.
MI Value
(91.8%)
The regional value is compared to the Michigan State value.
US Value
(89.1%)
The regional value is compared to the national value.
Trend
This comparison measures the indicator’s values over multiple time periods.<br>The Mann-Kendall Test for Statistical Significance is used to evaluate the trend<br>over 4 to 10 periods of measure, subject to data availability and comparability.
County: Washtenaw
Education / School Environment
Value
Compared to:
County: Washtenaw Student-to-Teacher Ratio
County: Washtenaw Student-to-Teacher Ratio
15.1
Students per teacher
(2022-2023)
Compared to:
MI Counties
The distribution is based on data from 83 Michigan counties.
U.S. Counties
The distribution is based on data from 3,125 U.S. counties and county equivalents.
MI Value
(16.7)
The regional value is compared to the Michigan State value.
US Value
(15.4)
The regional value is compared to the national value.
Prior Value
(15.2)
Prior Value compares a measured value with the previously measured value. Confidence intervals were not taken into account in determining the direction of the comparison.
Trend
This comparison measures the indicator’s values over multiple time periods.<br>The Mann-Kendall Test for Statistical Significance is used to evaluate the trend<br>over 4 to 10 periods of measure, subject to data availability and comparability.
County: Washtenaw
Education / Student Performance K-12
Value
Compared to:
County: Washtenaw 4th Grade Students Proficient in English/Language Arts
County: Washtenaw 4th Grade Students Proficient in English/Language Arts
53.6%
(2023)
Compared to:
MI Counties
The distribution is based on data from 82 Michigan counties.
MI Value
(44.8%)
The regional value is compared to the Michigan State value.
Prior Value
(54.8%)
Prior Value compares a measured value with the previously measured value. Confidence intervals were not taken into account in determining the direction of the comparison.
County: Washtenaw 8th Grade Students Proficient in Math
County: Washtenaw 8th Grade Students Proficient in Math
47.8%
(2023)
Compared to:
MI Counties
The distribution is based on data from 81 Michigan counties.
MI Value
(37.0%)
The regional value is compared to the Michigan State value.
Prior Value
(50.6%)
Prior Value compares a measured value with the previously measured value. Confidence intervals were not taken into account in determining the direction of the comparison.
County: Washtenaw High School Graduation
County: Washtenaw High School Graduation
86.7%
(2022)
Compared to:
MI Counties
The distribution is based on data from 82 Michigan counties.
MI Value
(81.0%)
The regional value is compared to the Michigan State value.
US Value
(86.5% in 2020)
The regional value is compared to the national value. The source for the national value is National Center for Education Statistics
Prior Value
(86.6%)
Prior Value compares a measured value with the previously measured value. Confidence intervals were not taken into account in determining the direction of the comparison.
Trend
This comparison measures the indicator’s values over multiple time periods.<br>The Mann-Kendall Test for Statistical Significance is used to evaluate the trend<br>over 4 to 10 periods of measure, subject to data availability and comparability.
HP 2030 Target
(90.7%)
County: Washtenaw
Environmental Health / Air
Value
Compared to:
County: Washtenaw Annual Ozone Air Quality
County: Washtenaw Annual Ozone Air Quality
3
(2019-2021)
Compared to:
Air Quality Index
The American Lung Association (ALA) assigns grades A-F to counties (A=1; B=2; C=3; D=4; F=5), based on average annual number of days that ozone levels exceeded U.S. standards during the three year measurement period. The five-point grading scale was used for the distribution (Green = <2; Yellow = 2 - 3; Red = >3). The air quality data is collected by the EPA and summarized by the ALA.
Prior Value
(5)
Prior Value compares a measured value with the previously measured value. Confidence intervals were not taken into account in determining the direction of the comparison.
Trend
This comparison measures the indicator’s values over multiple time periods.<br>The Mann-Kendall Test for Statistical Significance is used to evaluate the trend<br>over 4 to 10 periods of measure, subject to data availability and comparability.
County: Washtenaw Annual Particle Pollution
County: Washtenaw Annual Particle Pollution
2
(2019-2021)
Compared to:
Air Quality Index
The American Lung Association (ALA) assigns grades A-F to counties (A=1; B=2; C=3; D=4; F=5), based on average annual number of days that particle pollution levels exceeded U.S. standards during the three year measurement period. The five-point grading scale was used for the distribution (Green = <2; Yellow = 2 - 3; Red = >3). The air quality data is collected by the EPA and summarized by the ALA.
Prior Value
(2)
Prior Value compares a measured value with the previously measured value. Confidence intervals were not taken into account in determining the direction of the comparison.
Trend
This comparison measures the indicator’s values over multiple time periods.<br>The Mann-Kendall Test for Statistical Significance is used to evaluate the trend<br>over 4 to 10 periods of measure, subject to data availability and comparability.
County: Washtenaw Recognized Carcinogens Released into Air
County: Washtenaw Recognized Carcinogens Released into Air
19,210
Pounds
(2022)
Compared to:
Prior Value
(33,053)
Prior Value compares a measured value with the previously measured value. Confidence intervals were not taken into account in determining the direction of the comparison.
Trend
This comparison measures the indicator’s values over multiple time periods.<br>The Mann-Kendall Test for Statistical Significance is used to evaluate the trend<br>over 4 to 10 periods of measure, subject to data availability and comparability.
County: Washtenaw
Environmental Health / Built Environment
Value
Compared to:
County: Washtenaw Access to Exercise Opportunities
County: Washtenaw Access to Exercise Opportunities
90.1%
(2024)
Compared to:
MI Counties
The distribution is based on data from 83 Michigan counties.
U.S. Counties
The distribution is based on data from 3,096 U.S. counties and county equivalents.
MI Value
(85.6%)
The regional value is compared to the Michigan State value.
US Value
(84.1%)
The regional value is compared to the national value.
Prior Value
(87.8%)
Prior Value compares a measured value with the previously measured value. Confidence intervals were not taken into account in determining the direction of the comparison.
County: Washtenaw Access to Parks
County: Washtenaw Access to Parks
75.5%
(2020)
Compared to:
MI Counties
The distribution is based on data from 83 Michigan counties.
MI Value
(73.8%)
The regional value is compared to the Michigan State value.
Prior Value
(52.2%)
Prior Value compares a measured value with the previously measured value. Confidence intervals were not taken into account in determining the direction of the comparison.
County: Washtenaw Food Environment Index
County: Washtenaw Food Environment Index
8.2
(2024)
Compared to:
MI Counties
The distribution is based on data from 82 Michigan counties.
U.S. Counties
The distribution is based on data from 3,108 U.S. counties and county equivalents.
MI Value
(7.2)
The regional value is compared to the Michigan State value.
US Value
(7.7)
The regional value is compared to the national value.
Prior Value
(8.1)
Prior Value compares a measured value with the previously measured value. Confidence intervals were not taken into account in determining the direction of the comparison.
Trend
This comparison measures the indicator’s values over multiple time periods.<br>The Mann-Kendall Test for Statistical Significance is used to evaluate the trend<br>over 4 to 10 periods of measure, subject to data availability and comparability.
County: Washtenaw Liquor Store Density
County: Washtenaw Liquor Store Density
14.3
Stores per 100,000 population
(2021)
Compared to:
MI Counties
The distribution is based on data from 52 Michigan counties.
U.S. Counties
The distribution is based on data from 1,477 U.S. counties and county equivalents.
MI Value
(15.8)
The regional value is compared to the Michigan State value.
US Value
(10.7)
The regional value is compared to the national value.
Prior Value
(14.3)
Prior Value compares a measured value with the previously measured value. Confidence intervals were not taken into account in determining the direction of the comparison.
Trend
This comparison measures the indicator’s values over multiple time periods.<br>The Mann-Kendall Test for Statistical Significance is used to evaluate the trend<br>over 4 to 10 periods of measure, subject to data availability and comparability.
County: Washtenaw Proximity to Highways
County: Washtenaw Proximity to Highways
6.2%
(2020)
Compared to:
MI Counties
The distribution is based on data from 83 Michigan counties.
MI Value
(5.7%)
The regional value is compared to the Michigan State value.
Prior Value
(6.4%)
Prior Value compares a measured value with the previously measured value. Confidence intervals were not taken into account in determining the direction of the comparison.
County: Washtenaw
Environmental Health / Toxins & Contaminants
Value
Compared to:
County: Washtenaw Houses Built Prior to 1950
County: Washtenaw Houses Built Prior to 1950
16.2%
(2018-2022)
Compared to:
MI Counties
The distribution is based on data from 83 Michigan counties.
U.S. Counties
The distribution is based on data from 3,133 U.S. counties and county equivalents.
MI Value
(21.6%)
The regional value is compared to the Michigan State value.
US Value
(16.7%)
The regional value is compared to the national value.
Trend
This comparison measures the indicator’s values over multiple time periods.<br>The Mann-Kendall Test for Statistical Significance is used to evaluate the trend<br>over 4 to 10 periods of measure, subject to data availability and comparability.
County: Washtenaw PBT Released
County: Washtenaw PBT Released
1
Pounds
(2022)
Compared to:
Prior Value
(1)
Prior Value compares a measured value with the previously measured value. Confidence intervals were not taken into account in determining the direction of the comparison.
Trend
This comparison measures the indicator’s values over multiple time periods.<br>The Mann-Kendall Test for Statistical Significance is used to evaluate the trend<br>over 4 to 10 periods of measure, subject to data availability and comparability.
County: Washtenaw
Environmental Health / Weather & Climate
Value
Compared to:
County: Washtenaw Daily Dose of UV Irradiance
County: Washtenaw Daily Dose of UV Irradiance
3,122.0
Joule per square meter
(2020)
Compared to:
MI Counties
The distribution is based on data from 83 Michigan counties.
MI Value
(3,021.0)
The regional value is compared to the Michigan State value.
Prior Value
(3,165.0)
Prior Value compares a measured value with the previously measured value. Confidence intervals were not taken into account in determining the direction of the comparison.
Trend
This comparison measures the indicator’s values over multiple time periods.<br>The Mann-Kendall Test for Statistical Significance is used to evaluate the trend<br>over 4 to 10 periods of measure, subject to data availability and comparability.
County: Washtenaw Number of Extreme Heat Days
County: Washtenaw Number of Extreme Heat Days
19
Days
(2021)
Compared to:
Prior Value
(24)
Prior Value compares a measured value with the previously measured value. Confidence intervals were not taken into account in determining the direction of the comparison.
Trend
This comparison measures the indicator’s values over multiple time periods.<br>The Mann-Kendall Test for Statistical Significance is used to evaluate the trend<br>over 4 to 10 periods of measure, subject to data availability and comparability.
County: Washtenaw Number of Extreme Heat Events
County: Washtenaw Number of Extreme Heat Events
15
Events
(2021)
Compared to:
Prior Value
(21)
Prior Value compares a measured value with the previously measured value. Confidence intervals were not taken into account in determining the direction of the comparison.
Trend
This comparison measures the indicator’s values over multiple time periods.<br>The Mann-Kendall Test for Statistical Significance is used to evaluate the trend<br>over 4 to 10 periods of measure, subject to data availability and comparability.
County: Washtenaw Number of Extreme Precipitation Days
County: Washtenaw Number of Extreme Precipitation Days
29
Days
(2021)
Compared to:
Prior Value
(27)
Prior Value compares a measured value with the previously measured value. Confidence intervals were not taken into account in determining the direction of the comparison.
Trend
This comparison measures the indicator’s values over multiple time periods.<br>The Mann-Kendall Test for Statistical Significance is used to evaluate the trend<br>over 4 to 10 periods of measure, subject to data availability and comparability.
County: Washtenaw Weeks of Moderate Drought or Worse
County: Washtenaw Weeks of Moderate Drought or Worse
14
Weeks per year
(2021)
Compared to:
Prior Value
Prior Value compares a measured value with the previously measured value. Confidence intervals were not taken into account in determining the direction of the comparison.
Trend
This comparison measures the indicator’s values over multiple time periods.<br>The Mann-Kendall Test for Statistical Significance is used to evaluate the trend<br>over 4 to 10 periods of measure, subject to data availability and comparability.
