Carousel with 3 slides shown one at a time. Use the Previous and Next buttons to navigate, or the tab buttons at the end to jump to specific slides.


Search here! I am interested in learning more about:
Data
See our Community Health Assessment
See what we learned in our 2023 Washtenaw County Community Health Assessment.
See what we learned in our 2023 Washtenaw County Community Health Assessment.
Find Health Data
View more than 150 health and socio-economic indicators for the region, each county, or a unique zip code.
View more than 150 health and socio-economic indicators for the region, each county, or a unique zip code.
Create Reports
Customize a quick report for a topic of your interest.
Customize a quick report for a topic of your interest.
Community Dashboards
Compare indicators for your community against state averages, county values, and target goals.
Compare indicators for your community against state averages, county values, and target goals.
Stories
Reflections from a Health Department Intern
Read what Sarah R. Akaaboune learned working on our community health improvement work.
A Community Health Worker's Impact in Sycamore Meadows
A spotlight on how Kelly Goolsby uses her skills to build community in Sycamore Meadows.
A spotlight on how Kelly Goolsby uses her skills to build community in Sycamore Meadows.
State of Our Health: Reflections & a Path Forward
This event was a product of hundreds of hours of diligent data collection, research, meaningful collaboration, shared understanding, and mostly, a unique love and care for Washtenaw County's community members.
Action
Promising Practices
View promising practices highlighting efforts around the country addressing community health challenges.
View promising practices highlighting efforts around the country addressing community health challenges.
Funding Opportunities
View funding opportunities for specific community health challenges.
View funding opportunities for specific community health challenges.
Health for All Steering Committee Action
Read the Committee's 2020 Solidarity Statement.
Read the Committee's 2020 Solidarity Statement.
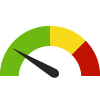
Health for All Number of the Month:
Adults who have had a Routine Checkup
69.8%


This indicator shows the percentage of adults that report having visited a doctor for a routine checkup within the past year.
Data Source: Michigan BRFSS